The dollar-value LIFO method is a calculation designed to be performed annually or one time each reporting period (this is the method used by the vast majority of companies using LIFO). Furthermore, IRS Regs. prescribes for LIFO to be applied annually & never mentions performing interim LIFO estimates for tax purposes. With that being said, many companies perform interim LIFO estimates for a wide array of reasons, including the following:
Publicly traded companies – SEC filers are required to perform an estimate of the interim cost of sales on their quarterly financial reports. Because of this, publicly traded companies on LIFO are required to perform interim LIFO estimates.
Financial reporting compliance – Although GAAP does not explicitly state that interim LIFO estimates are required, the AICPA’s 1984 LIFO Issues Paper states that an estimate for the interim cost of sales is “required”. Accordingly, companies that issue financial statements in accordance with GAAP are often advised by their auditors to perform interim LIFO estimates (Issues Paper is not authoritative guidance, so many companies issuing GAAP financial statements do not perform interim estimates). Also, some companies are required to issue interim financial reports to creditors/lenders or suppliers, and as a result, these companies may also include an estimated LIFO adjustment in their interim estimates.
Tax compliance – Although tax law defines LIFO as an annual calculation, many companies perform interim estimates in order to incorporate the LIFO effect into their quarterly estimated tax payments as it aligns taxable income more closely than it would without LIFO
Forecasting and planning – Many companies perform interim LIFO estimate(s) to properly forecast and plan the estimated LIFO effect on their bottom line. An added benefit of doing so is to smooth out the effect of the estimated LIFO reserve change over the course of the year as opposed to booking a single LIFO adjustment at year end. An added benefit of forecasting & planning is that one can avoid material or unexpected surprises from LIFO at year end. These types of estimates come in many shapes and forms in terms of frequency, including mid-year estimates, ones made towards the end of the year, and some even perform estimates on a monthly basis (monthly estimates are the least common interim estimate frequency).
Maximize the LIFO reserve increase (or minimize the decrease) – When there’s inflation, a minimum “Current-year cost” balance (Current-year cost can be thought of as inventory at cost i.e., FIFO or average cost) is required to avoid what is known as layer-erosion effect LIFO income (Layer-erosion effect LIFO income is also commonly referred to as “LIFO recapture”, but it essentially represents a reduction in the current vs. prior year’s LIFO reserve). When there’s inflation and this vs. last year’s Current-year cost balance is less than the product of the current year inflation index and last year’s Current-year cost (called “Zero layer erosion Current-year cost), the inflation effect LIFO expense (LIFO reserve increase attributable to inflation) will be reduced by layer-erosion income (or in some cases, a net LIFO reserve decrease can occur from substantial layer erosion income). Because of this, some companies perform interim estimates within a couple months of their year end to determine if they LIFO recapture could occur at their current or projected year end inventory levels, and possibly adjust their purchases that will be made prior to their year end to achieve the most favorable LIFO results from a tax perspective.
Are There Rules Regarding How Interim Estimates Must be Performed?
No authoritative financial reporting guidance or tax law exists as to how exactly interim estimates must be performed. Although the AICPA Issues Paper describes three interim estimate approaches, it is not authoritative guidance (furthermore, some of the recommendations are outdated and are no longer applicable since electronic accounting information systems were primitive or non-existent for most companies). Because of this, the form and fashion of interim estimates varies widely. As a result, companies have the luxury of employing the most practical interim estimate approach that best matches their financial report user’s wants/needs. Often times, considerations included in selecting an interim estimate approach include materiality, practicality, administrative burden and the desired reliability/accuracy of the estimate results.
What Interim LIFO Estimate Approaches are Available?
The varying approaches can be broken down into the following categories:
Interim estimate frequency – The frequency of interim estimates is often based on the need of the financial report users or requirements of creditors and suppliers. The most common frequency types are as follows:
Quarterly – For publicly-traded companies, interim estimates must be performed on a quarterly basis since SEC filers are required to file quarterly financial reports. Companies issuing GAAP financial statements often also perform quarterly estimates. Some companies also desire performing quarterly interim estimates in order to incorporate the LIFO effect into their quarterly estimated tax payments.
Single estimate – Some companies may decide to only perform a single interim estimate if they’re not required to issue quarterly financial reports. This often occurs as a “mid-year projection” in the middle of the reporting period, but it can also occur towards the end of the year. Performing an interim estimate at least once a year allows companies to “smooth out” the effect of LIFO and to prevent what would otherwise be a meaningful post-year end, top-side adjustment resulting from the final year end calculation.
Monthly – This is the least commonly occurring frequency. With that being said, certain companies are required by their lenders, shareholders or suppliers to issue monthly financial reports. Other companies perform monthly interim estimates to further smooth out the effect of LIFO. Companies who perform monthly interim LIFO estimates will most likely be utilizing LIFO software or an outsourcing solution in order to reduce or minimize the administrative burden.
Not performed at all (or performed “as-needed”) – Some companies don’t perform interim estimates at all for the following reasons:
Interim financial reports are not issued
The LIFO reserve change is highly immaterial to the cost of sales and a company’s bottom line. This is most often the case when one or more of the following is true:
Company’s product mix consists of low-inflation, low-volatility items – This can result in the interim changes in the LIFO reserve being immaterial and/or consistent from one period to the next.
Immaterial portion of the inventories are valued using LIFO – Some companies only have a small portion of their inventories valued under the LIFO method. A common example of this is a parent company whose inventories are valued using FIFO that also has a smaller subsidiary (or set of subsidiaries) who was/were on LIFO both before and after the subsidiary was acquired/formed.
Inflation measurement source – The inflation measurement source of interim estimates are typically based on the approach used for the actual year end LIFO computation. With that being said, some companies will use an alternative inflation measurement source for interim estimates to simplify the process and avoid undue administrative burden. Common inflation measurement sources used for interim reporting purposes include the following:
External Index – Also known as the IPIC method. Uses Bureau of Labor Statistics Consumer/Producer Price Indexes (BLS CPI/PPI). Almost all companies who use the IPIC method to perform their year end LIFO calculation will also do so for interim reporting purposes because of its simplicity. External indexes are also sometimes used as a substitute inflation calculation source by internal index users for interim reporting purposes as it can be simpler than performing the equivalent of a full year end internal index inflation. Also, some companies will use the inflation for the most predominant BLS CPI/PPI categories applicable to their product mix as a primary or secondary factor in determining a judgmental index to be used for interim reporting purposes.
Internal Index – Uses a company’s on-hand quantities, current & prior period’s item/unit costs to calculate inflation. The majority of companies who use internal indexes to measure inflation for their year end calculation will also use internal indexes to calculate their interim estimates. With that being said, in some cases, performing the equivalent of a full year-end LIFO calculation can create an undue amount of administrative burden (which can be common for manufacturers, including those with material amounts of work in process inventories). Because of this, certain internal index users will use BLS CPI/PPIs or a judgmental index to calculate their interim LIFO inflation in order to minimize the effort.
Judgmental Index – Uses management’s best estimate of the inflation expected to occur during the interim reporting period or over the course of whole reporting period. Sources include the following:
Performing high-level comparison of price changes for the most predominant goods or items that represent the highest inventory value (as opposed to calculating inflation at the item level i.e. SKU/UPC)
Comparing price changes between the current vs. prior period’s purchases for the most predominant items
Using supplier/vendor notifications regarding price changes that have occurred or will occur during the current reporting period
Using external government or industry inflation data such as the BLS CPI/PPI mentioned above
Inflation measurement timeframe
Year to date – Compares price changes as of the interim reporting date vs. the last fiscal year end reporting date. For example, a company with a December year end who most recently closed its 2022 year end would compare March, June or September 2023 quantities and prices against the December 2022 year end prices to calculate year to date inflation for each of their three quarterly 2023 year end interim estimates when using year to date amounts (aforementioned example assumes link-chain method is used; double extension method compares current quantities and costs against base year costs). This is the most predominantly-used approach.
1 year or 12M ended interim report date (annualized)– Compares price changes as of the interim reporting date vs. the prior 12 month period. For example, a company with a December year end who most recently closed it’s 2022 year end would compare March, June and September 2023 quantities and prices against the March, June and September 2022 prices to calculate the 12M ended interim report date inflation. This is much less-commonly used, but can be the most effective approach of calculating inflation when attempting to project a full year-end LIFO calculation and pro-rating those results amongst interim periods.
Level of detail – This defines whether actual or current period or projected/estimated values are used to perform the interim LIFO calculation.
Using actual or current period amounts – This infers that the same data/variables used for the year-end calculation is used for the interim estimate, which includes the following:
Current interim reporting period’s inventory balance at cost or “Current-year Cost” is used for the calculation
Internal index – Infers that the current period’s quantities and item/unit costs are used to calculate inflation on an item-by-item basis.
External index (IPIC method) –
Current period’s product mix is used to assign BLS categories for purposes of calculating inflation – For example, for a company with a December year end who most recently closed their 2022 year end, the Q1 2023 interim estimate would be performed using by assigning BLS CPI/PPI categories to the March 2023 product mix.
Year to date or 12M ended interim reporting date BLS CPI/PPI inflation is used to calculate inflation
Using projected or prior year amounts – This infers one or more variable(s) involved in the LIFO calculation is an estimated value rather than an actual current period amount, which includes the following:
Projected year to date/current year end or prior year end inventory balance is used as the Current-year Cost for the interim calculation. An example would be where despite the interim reporting period’s inventory balance being $5M, the Current-year Cost used for the calculation is $6M based on this amount being the projected year end inventory balance.
External indexes: Prior year end’s product mix and BLS category assignments are used as the weights for the current year index computation – This is a very common approach because it precludes the need to assign BLS CPI/PPI categories to new items each interim reporting period (meaning BLS categories are only assigned to new items annually for year end calculation). In addition to minimizing administrative burden, in most industries, the difference between using the current period’s vs. prior year end’s product mix to calculate inflation is negligible because the product mix will not substantially change from one period to the next (unless there’s a material business acquisition or addition/discontinuation of a key business unit or product line).
Internal indexes: Infers something other than the equivalent of a full year end internal index calculation is performed. This includes substituting an internal index for a judgmental index.
Interim LIFO Adjustment Recognition Approach
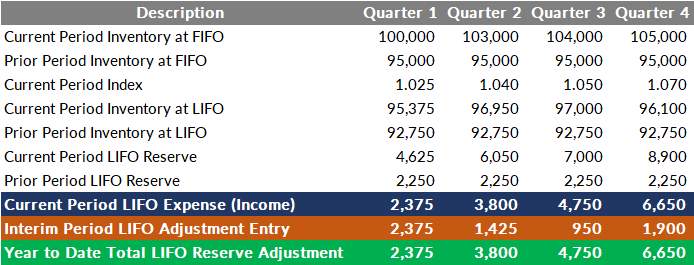
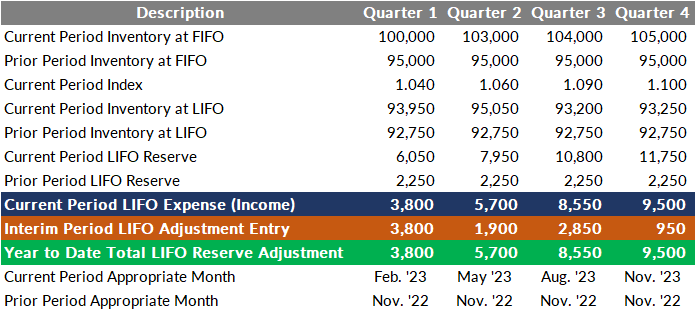
Recognize 100% of interim period results (Approach #1)- this is most commonly employed when a year to date inflation measurement timeframe is used. For example, for a company with a December year end who has most recently closed its 2022 year end, the Q1 2023 LIFO adjustment would be based on the results of the 3M ended March 2023 LIFO calculation results (assuming internal indexes are used; external index users may use 3M ended February ’23 or Feb. ’23 ÷ Nov. ’22 CPI/PPI since BLS indexes have a one-month lag in their release dates). In such cases, when the Q2 2023 interim LIFO estimate is performed, the Q2 2023 LIFO calculation would be performed using 6M ended June 2023 LIFO calculation results, and the adjustment entry would be the difference between the Q2 and Q1 2023 LIFO reserves. See the Figures below labelled as “Approach #1” for illustrative examples. Support for Approach #1 is based on the principle that interim reporting period results should only account for the results of transactions and other events that have occurred, not also transactions that might occur. Said another way, Approach #1 matches the most recently incurred costs with current revenues as of the interim reporting period, and it excludes factors that will occur outside of the current reporting period.
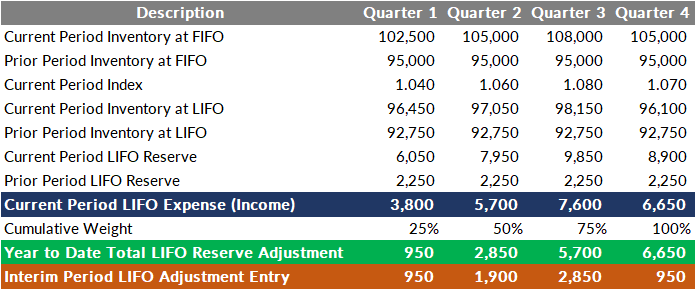
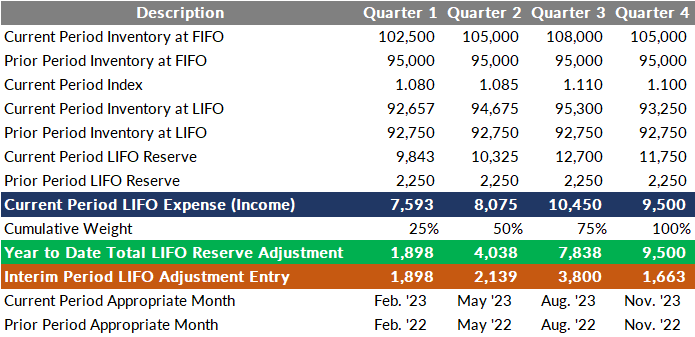
Recording a pro-rated portion of the full year’s LIFO calculation results (Approach #2) – this is most commonly employed when a full year end or 12M inflation measurement timeframe is employed. For example, for a company with a December year end who has most recently closed its 2022 year end, the Q1 2023 LIFO adjustment would be based on the results of the 12M ended March 2023 LIFO calculation results (or projected 12M ended December 2023 results) multiplied by a 25% weighting factor. In such cases, when the Q2 2023 interim LIFO estimate is performed, the LIFO adjustment amount will be based on the difference between the Q2 2023 LIFO reserve multiplied by a 50% weighting factor and the Q1 2023 LIFO reserve. See the Figures below labelled as “Approach #2” for illustrative examples. Support for the Approach #2 includes the fact that LIFO is intended to be an annual calculation, not a quarterly computation (tax law defines LIFO as an annual calculation).
Sample Interim LIFO Estimates
Several examples of completing interim LIFO estimates are shown below.
Figure 1. Internal Index Interim LIFO Estimate Results – Using Actual Interim Period End Quantities, Costs and Inventory Balance (Approach #1)
Figure 2. Internal Index Interim LIFO Estimate Results – Using Projected & Annualized LIFO Calculation Results (Approach #2)
Figure 3. External Index Interim LIFO Estimate Results – Using Year to Date BLS Inflation (Approach #1)
Figure 4. External Index Interim LIFO Estimate Results – Using 12M Ended Interim Reporting Date (Annualized) & Pro-rated LIFO Calculation Results (Approach #2)
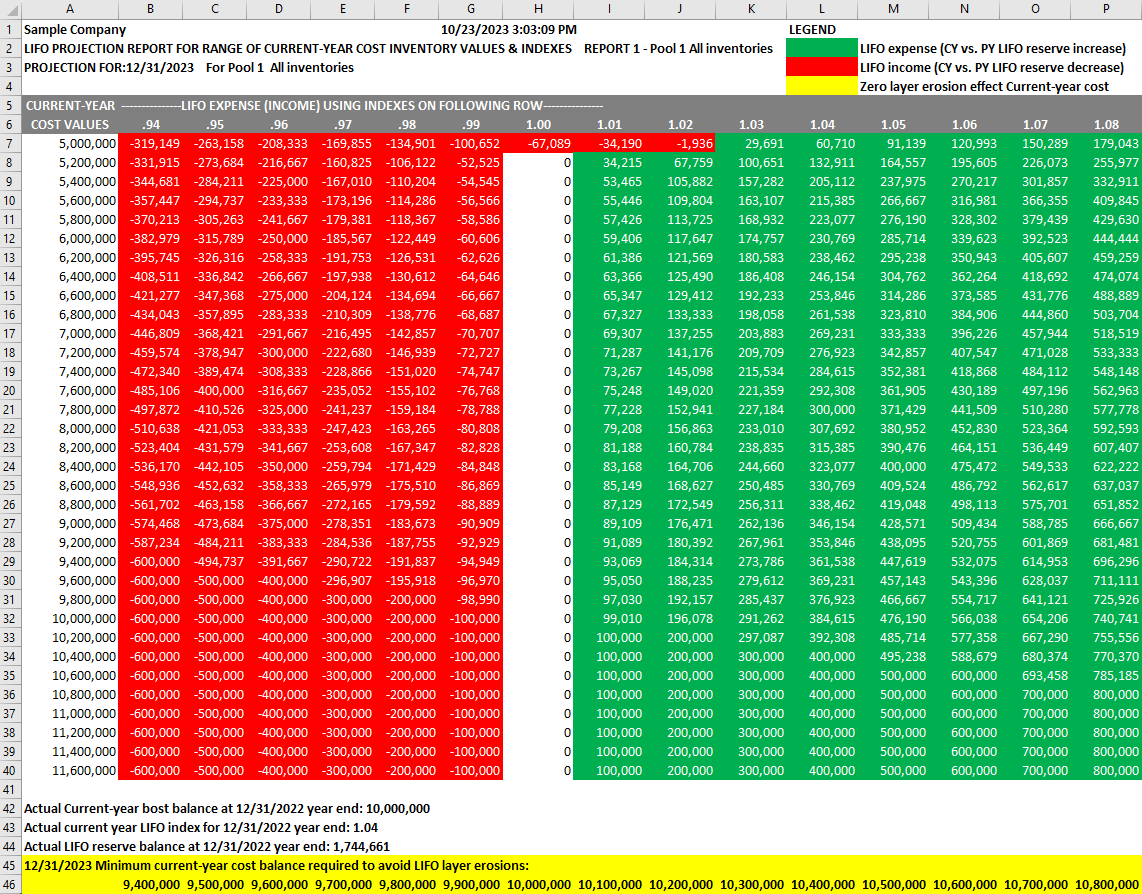
LIFOPro’s Projection Report
LIFOPro software users and outsourcing clients have access to the most comprehensive ad-hoc forecasting and planning tool in our LIFO Projection Report (named Report 1). It shows next year’s projected LIFO reserve change amounts for hundreds of calculation scenarios within a single report. The report is automatically generated by our software and is based on the results of the last period closed, a range of next year’s Current-year cost balances & current year indexes. Report 1 also shows the minimum Current-year Cost balance required to avoid layer erosion LIFO income (useful for planning purposes as it highlights the relationship between the LIFO reserve change and the year over year inventory balance change). Using this report, an unlimited range of LIFO calculation outcomes can be obtained, making it an invaluable resource for interim estimate purposes. What would likely take hours to manually perform in an Excel file is generated within a few seconds with a single click of the button in the LIFOPro software. Here’s how Report 1 works:
Inputs (automatically set by software, but the values and increments between those values are modifiable to include the user’s desired range)
Range of next year’s Current-year cost balances – Shown from top to bottom in Column A starting on row 7 (inventory balance at FIFO, average cost, etc.). The first value shown and the increments between each value are pre-defined when generated within the software, but they are modifiable to meet the user’s desired rage. For example, the software user or client can set/request to have the first FIFO value to be shown to equal $1M and for the increments to be $250K (as opposed to the $2M value
Range of next year’s Current year index – Shown from left to right on Row 6 starting in Column B (represents current year inflation. Index of .95 = 5% deflation; index of 1.05 = 5% inflation). The first value shown and the increments between each value are also pre-defined when generated within the software, but they also are modifiable to meet the user’s desired rage.
LIFOPro software database file – accessed in the background within the software upon opening Report 1
Outputs (calculated in the background within the software upon opening Report 1)
Matrix of next year’s projected LIFO expense/income values – Shown starting on Row B7 based on the intersecting Current-year cost and Current year index values listed in Column A & Row 6. Positive amounts shown in Report 1 represent LIFO expense and negative amounts are LIFO income (LIFO expense represents a current vs. prior year LIFO reserve increase, and income represents a decrease). For example, in the Report 1 shown in Figure 5 below, if the expected Current-year cost value for the 2023 year end is $9M and the expected 2023 current year index is 1.02 (2% inflation), you’ll find the 2023 LIFO expense of $176,471 in cell J27, which is the cell that intersects with the aforementioned input values. In this example, the 2023 LIFO reserve would be $1,921,132, which is the sum of the prior year LIFO reserve balance of $1,744,661 (Row 44) and the current year LIFO expense of $176,471. The same math applies for all amounts shown within this report.
Minimum Current-year Cost balance required to avoid layer erosion LIFO income (referred to as Zero layer erosion Current-year cost) – Shown on the last row of Report 1 from left to right starting in Column B. These figures are calculated by multiplying last year’s Current-year cost by next year’s projected Current year index. The zero layer erosion Current-year cost represents the following:
Minimum inventory balance required to achieve the highest LIFO reserve increase when there’ inflation – As shown below in Figure 5, when the Column A Current-year cost value is greater than or equal to the Minimum Current-year cost balances required to avoid LIFO layer erosions shown on Row 46, the maximum LIFO expense figure for the corresponding index is achieved. Furthermore, since the amount of LIFO expense is capped by the amount of inflation, the LIFO reserve increase will be the same once you surpass the Zero layer erosion Current-year cost value. For example, using Report 1 shown below in Figure 5, let’s assume that next year’s Current year index will be 1.02 or 2% inflation (shown in Column J) and the Zero layer erosion Current-year cost is $10,200,000. In this example, this means the maximum LIFO expense that can occur when there’s 2% inflation will be $200,000 for the 2023 year end. As shown in Cells J33:J40, you’ll notice the LIFO expense remains the same amount once the Current-year cost shown in Column A is greater than or equal to Zero layer erosion Current-year cost of $10.2M. This is because in any given year with inflation, the maximum LIFO expense is equal to the product of last year’s Current-year cost and this year’s inflation rate.
Layer erosion LIFO income (LIFO reserve decrease) is created when there’s inflation & the Current-year cost is less than the Zero layer erosion Current-year cost – As shown below in Figure 5, when there’s inflation (index of 1.0 or greater; shown on row 6 below) and next year’s Current-year cost value (Column A) is less than the Minimum Current-year cost balances required to avoid LIFO layer erosions (Row 46), the LIFO expense amount begins to decrease. For example, lets once again assume the Current year index is 1.02, which is shown in Column J. In this example, the Minimum Current-year cost to avoid layer erosions at 2% inflation is $10.2M. As seen in Figure 5, the LIFO expense for 2% inflation when the Current-year cost is greater than or equal to $10.2M is $200K, but it reduces to $196,018 if the Current-year cost is $10M ($200K less than the Zero layer erosion Current-year cost). To further the example, if the Current-year cost decreases to $5.2M and there was 2% inflation, the total LIFO expense is reduced to $67,759, and once the Current-year cost is reduced to $5M under a 2% inflation assumption, the 2023 LIFO reserve change flips to a negative amount, which represents LIFO income. The two key takeaways are as follows:
When there’s inflation, the amount of LIFO expense becomes less and less the more the Current-year cost value decreases below the Zero layer erosion effect Current-year cost. This is because the LIFO reserve change is the sum of the following two components:
Inflation effect LIFO expense/income: Last year’s Current-year cost * Current year inflation rate. Component is always included in the LIFO reserve change calculation
Layer erosion effect LIFO income/expense: Decrease at base year cost * (Current year cumulative index – index of layer(s) being eroded). Component is only included in the LIFO reserve change calculation when this year’s Current-year cost is less than the Zero layer erosion Current-year cost & its corresponding Current year index (Zero layer erosion Current-year cost = last year’s Current-year cost * this year’s inflation rate)
The LIFO reserve can and will increase when there’s inflation, but it will be LESS than the maximum LIFO reserve increase if this year’s Current-year cost is less than the Zero layer erosion Current-year cost (
Layer erosion LIFO expense (LIFO reserve increase) is created when there’s deflation & the Current-year cost is less than the Zero layer erosion Current-year cost – As shown below in Figure 5, when there’s deflation (index of less than 1.0) and next year’s Current-year cost value (Column A) is less than the Minimum Current-year cost balances required to avoid LIFO layer erosions (Row 46), the LIFO income amount begins to decrease. For example, lets assume the Current year index is .95 (5% deflation), which is shown in Column C. In this example, the Minimum Current-year cost to avoid layer erosions at 5% deflation is $9.6M. As seen in Figure 5, there’ll be $500K of LIFO income at a 5% deflation if the Current-year cost is at or above the Zero layer erosion Current-year cost, but it begins to decrease below this amount. For example, when there’s 5% deflation and a Current-year cost of $9M, the LIFO income decreases from $500K to $473,684, and if the Current-year cost were to decrease to $5M, the LIFO income is reduced to $263,158. This is because when there’s deflation AND layer erosion(s) that occur, the deflation effect LIFO income is reduced or offset by layer erosion expense.
Figure 5. LIFOPro’s Projection Report
Note: Report 1 shown above was created in the LIFOPro software & saved to an Excel file for presentation purposes (Report was not created in Excel).
Get educated on the Inventory Price Index Computation (IPIC) method, including the origins, advantages & disadvantages, calculation procedures, options & much more!
Learn about LIFO opportunities abound for CPA firms, how to increase the scope of your LIFO offerings & learn how to easily identify good LIFO candidates!
Learn how the IPIC LIFO Method works, find valuable Bureau of Labor Statistics (BLS) links and stay up to date on all changes related to the IPIC Method!
Learn about LIFOPro’s past roles in partnering with companies & CPA firms to deliver great value by finding solutions to the most challenging LIFO issues!
The Inventory Price Index Computation (IPIC) method allows taxpayers to use published external indexes to calculate inflation for the purpose of valuing LIFO inventories.
Supermarkets face LIFO calculation issues unique to the industry. Find out why & answers to how they are dealt with Special Challenges for Supermarkets page.
Why the Double-extension LIFO Index Calculation Method is Unreliable
Facts describing why the double-extension LIFO index calculation method is unreliable and examples proving how this method creates unpredictable results.
Find recent important changes & BLS addition of Table 9 Wherever-provided Services & Construction PPI Indexes & Important Change in PPI Code Structure page.
Find information on CPI Category Changes & Bureau of Labor Statistics Consumer Price Index update information such as new medical commodity codes here!
Learn IRS Regulations Requirements for missing PPI Indexes, procedures for reassigning discontinued PPI Categories at LIFO-PRO’s PPI Category Changes page.
Producer Price Index Usage by Supermarkets to Increase Tax Deferral
Learn how drugs, non-foods & food/beverage indexes cause increase LIFO tax benefits at our PPI Index Usage by Supermarkets to Increase Tax Deferral page.
Switching from the double-extension to link-chain method? Want to achieve higher possible inflation indexes? Learn more at the IPIC LIFO Advantages page.
Request a software trial, LIFO Election Benefit Analysis, Best LIFO Practices Methods Review or cost estimate. All of our requests are complimentary & free of obligation!
Accounting and financial professionals who work with LIFO need to understand the jargon associated with LIFO. Below are a number of LIFO-related terms.
Get answers to who should use the LIFO method, how much LIFO may benefit your company or client & good LIFO candidates by industry & principal business activity along with historical inflation data.
Have a phone call or WebEx with the LIFO-PRO team to get started today or learn more about our offerings. Schedule online using our easy-to use booking tool.