How LIFO Works
The LIFO inventory method matches current period revenues with the most recent period’s costs to provide a better measure of current earnings when there is inflation. The LIFO method transfers the inflationary portion of the ending inventory balance from the balance sheet to the income statement via cost of goods sold. When there’s inflation & a non-LIFO cost flow assumption is followed (i.e. FIFO, average cost, specific identification, earliest acquisitions), the ending inventory becomes higher than the cost of those same goods at the beginning of the year since inflation has caused those goods to become more expensive. For example, under an inflationary environment where the FIFO cost flow assumption is used, the same quantity of goods valued at $5 million at the beginning of the year that experienced 2% inflation by the end of the year would now be valued at $5,100,000 at year end. With the FIFO cost flow assumption, the cost of goods sold represents the lower priced goods that were purchased at the beginning of the year, and the higher-priced items remain in ending inventory. This results in a mismatch of current earnings & costs because the revenue will typically occur throughout the course of the year whereas the $100K inflationary component of the ending inventory balance gets left on the balance sheet, meaning the cost of goods sold reported for the period is lower than what it really should be.
For companies that use dollar-value LIFO, inventories continue to be valued at cost during the course of the year, meaning you continue to treat your inventory costs & purchases within your accounting information system/database the same way it’s currently being maintained now. The actual LIFO adjustment is treated as an annual side calculation made at the end of the year to determine the amount of inflation & adjustment that needs to be made to convert inventory from cost to LIFO. This is accomplished by setting up a contra-inventory account called the LIFO reserve. Using the amount from the example in the first paragraph, a company with $5 million of ending inventory on hand at the end of the year, 2% inflation and was electing LIFO for the first time would make a journal entry at year end to debit Cost of goods sold for $100,000 & credit the LIFO reserve contra-inventory account for $100,000 to reduce the ending inventory balance from cost to LIFO, or from $5m to $4.9m ($5m ending inventory balance @ cost x 2% inflation = $100K of LIFO expense/reserve. The LIFO expense = current year taxable income reduction & the LIFO reserve = cumulative taxable income reduction or more simply thought of as the difference between inventory @ cost & LIFO. LIFO expense/reserve will equal one another in a company’s first year on LIFO).
How LIFO Reduces Taxable Income & Generates After-tax Cash Savings
The reason why companies use LIFO is because it provides a means of perpetually reducing taxable income & thereby creating after-tax cash savings annually for companies are profitable (LIFO benefits can also be carried forward or backwards in periods where there is a net operating loss aka NOL). In the example above, the resulting journal entry converts the ending inventory balance from cost to LIFO, or from $5m to $4.9m, which also increases COGS to be $100K higher & also causes net income to be $100,000 less as a result. The benefit of this to the taxpayer is that LIFO reduced taxable income by $100K & created between $20,000 – $40,000 of after-tax cash savings (after-tax cash savings = taxable income reduction x tax rate). Although this example is for a single year, the tax savings from LIFO continues to accumulate every year where there’s inflation, meaning it acts as an annuity that will grow in perpetuity. For example, if at the end of year two, the company described above had the same Y2 ending inventory balance at cost of $5 million but instead had 1% inflation, the year two LIFO calculation would have created an additional $50K of LIFO benefits ($5m ending inventory balance @ cost * 1% inflation = $50,000). The year 2 calculation would result in an ending inventory balance of $4.85m after converting it from cost to LIFO, and the year two journal entry would be made to debiting Cost of goods sold for $50,000 & crediting the LIFO reserve for $50,000. After the second year, the company’s LIFO reserve balance would be $150,000. This means that the company has cumulatively reduced taxable income by $200K & has created $30 – 60K of after-tax cash savings over a two year period after their second year on LIFO.
RV Dealer Reduced Taxable Income (RTI) from LIFO Assuming 2% Average Annual Inflation
| Inventory Balance | 1 Year RTI | 3 Year RTI | 5 Year RTI | 10 Year RTI | 15 Year RTI | 20 Year RTI |
|---|---|---|---|---|---|---|
| $1,000,000 | $20,000 | $60,000 | $100,000 | $200,000 | $300,000 | $300,000 |
| $5,000,000 | $100,000 | $300,000 | $500,000 | $1,000,000 | $1,500,000 | $1,500,000 |
| $10,000,000 | $200,000 | $600,000 | $1,000,000 | $2,000,000 | $3,000,000 | $3,000,000 |
| $15,000,000 | $300,000 | $900,000 | $1,500,000 | $3,000,000 | $4,500,000 | $4,500,000 |
| $20,000,000 | $400,000 | $1,200,000 | $2,000,000 | $4,000,000 | $6,000,000 | $6,000,000 |
| $25,000,000 | $500,000 | $1,500,000 | $2,500,000 | $5,000,000 | $7,500,000 | $7,500,000 |
| $30,000,000 | $600,000 | $1,800,000 | $3,000,000 | $6,000,000 | $9,000,000 | $9,000,000 |
| $35,000,000 | $700,000 | $2,100,000 | $3,500,000 | $7,000,000 | $10,500,000 | $10,500,000 |
| $40,000,000 | $800,000 | $2,400,000 | $4,000,000 | $8,000,000 | $12,000,000 | $12,000,000 |
| $45,000,000 | $900,000 | $2,700,000 | $4,500,000 | $9,000,000 | $13,500,000 | $13,500,000 |
| $50,000,000 | $1,000,000 | $3,000,000 | $5,000,000 | $10,000,000 | $15,000,000 | $15,000,000 |
Defining Good LIFO Candidates
When weighing the costs & benefits of using the LIFO method, the following factors are key in determining if a company is a good LIFO candidate
- Inflation – When working with companies to determine if they’re a good LIFO candidate, we look for a historical average annual inflation greater than or equal to 1%. For a company with $20 million of inventory, 1% inflation will typically represent about $200,000 of taxable income reduction & somewhere between $40K – $80K of after-tax cash savings in a single year. When accumulated over 10 years, this amount would now represent $2 million of taxable income reduction & $400K – $800K of after-tax cash savings.
- Inflation frequency – Consistent inflation reduces the occurrence of drastically changing LIFO benefits from one year to the next. It also prevents large taxable income increases from becoming a common occurrence such as those commonly seen in the oil & gas industry.
- Calculation costs – since the use of the LIFO inventory method is optional, the calculation complexity & costs often play a key role in determining if a company will ultimately want to use LIFO. Said another way, the less complex and/or costly it is to be on LIFO, the more likely it is that a company will both elect & stay on LIFO.
Recreational vehicle dealerships are great LIFO candidates for the following reasons:
- Recreational vehicles have had historical average annual inflation of at least 1% or more over the past 20 years (see 3, 5, 10 & 20 year average annual inflation rates in Figure 1 below)
- Recreational vehicles have had consistent price increases historically, with inflation measured in 18 of each of the past 20 years (for each of the 12 month periods ended December between 2000 – 2019; see the rates in Figure 2 below)
- The cost to obtain software or outsource LIFO calculations are minimal for recreational vehicle dealerships since the product mix is typically limited to a handful of items (motor homes, travel trailers, campers & parts)
- External government inflation indexes can be used to calculate LIFO inflation, which avoids the need to have to develop internally calculated indexes using actual current & prior period costs (Bureau of Labor Statistics Producer Price Indexes are most commonly used. AKA BLS PPI)
- The same external index inflation category can be used for both new & used RVs
- Dealers who want to use LIFO but wish to maintain their their Lower of Cost or Market reserves can do so by selectively adopting the LIFO method for new equipment & parts only
Figure 1. Bureau of Labor Statistics (BLS) Producer Price Index (PPI) historical inflation rates for recreational vehicles, trailers & parts:
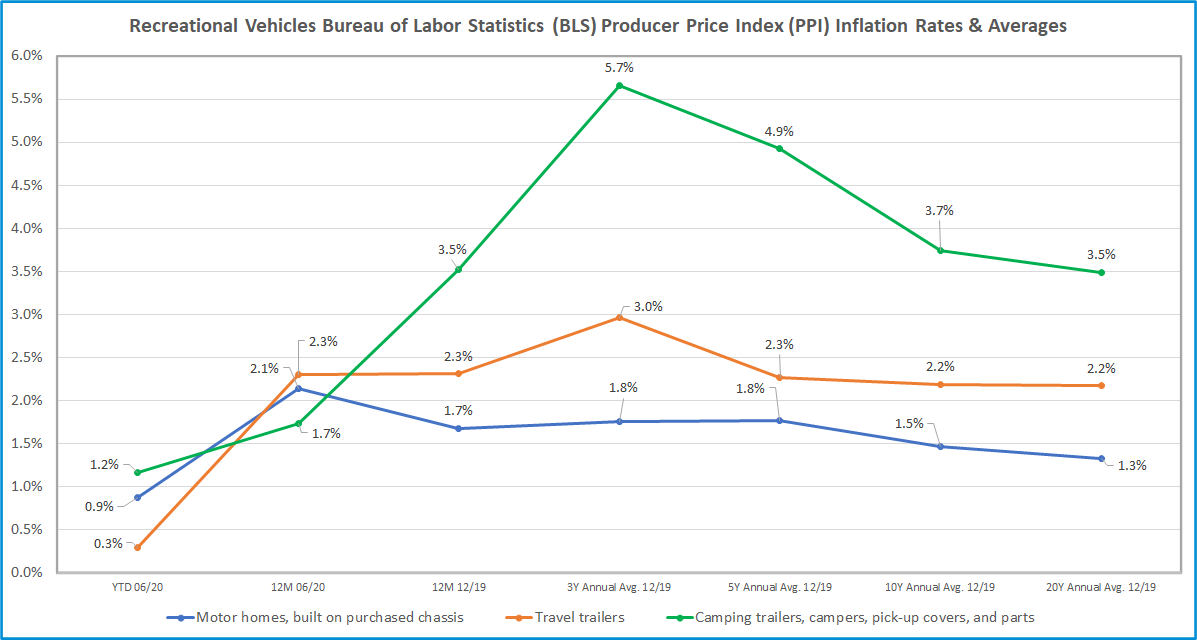
Figure 2. RV Dealership BLS PPI Inflation Rates & Frequency: 2000 – 2020
| BLS PPI Category / Inflation Period | Motor homes, built on purchased chassis | Travel trailers | Camping trailers, campers, pick-up covers, and parts |
|---|---|---|---|
| 6 Months Ended June '20 (YTD) | 0.9% | 0.3% | 1.2% |
| 12 Months Ended June '20 | 2.1% | 2.3% | 1.7% |
| 12 Months Ended Dec '19 | 1.7% | 2.3% | 3.5% |
| 12 Months Ended Dec '18 | 1.2% | 3.0% | 4.9% |
| 12 Months Ended Dec '17 | 2.4% | 3.6% | 8.6% |
| 12 Months Ended Dec '16 | 2.2% | 0.3% | 1.8% |
| 12 Months Ended Dec '15 | 1.4% | 2.1% | 5.9% |
| 12 Months Ended Dec '14 | 0.1% | 3.1% | 4.2% |
| 12 Months Ended Dec '13 | 0.5% | 2.6% | 0.6% |
| 12 Months Ended Dec '12 | 3.9% | 2.6% | 2.1% |
| 12 Months Ended Dec '11 | 0.2% | 4.0% | 3.9% |
| 12 Months Ended Dec '10 | 1.2% | -1.7% | 2.1% |
| 12 Months Ended Dec '09 | -5.0% | 0.6% | 0.5% |
| 12 Months Ended Dec '08 | 2.1% | 5.2% | 4.4% |
| 12 Months Ended Dec '07 | 3.1% | 1.3% | 3.6% |
| 12 Months Ended Dec '06 | -2.6% | 3.2% | 6.4% |
| 12 Months Ended Dec '05 | 2.6% | 4.3% | 2.0% |
| 12 Months Ended Dec '04 | 4.7% | 2.0% | 5.1% |
| 12 Months Ended Dec '03 | 2.0% | 2.3% | 2.9% |
| 12 Months Ended Dec '02 | 1.9% | 1.5% | 3.6% |
| 12 Months Ended Dec '01 | 1.9% | 0.4% | 1.8% |
| 12 Months Ended Dec '00 | 1.5% | 0.8% | 2.1% |
| 3 Year Annual Average | 1.8% | 3.0% | 5.7% |
| 5 Year Annual Average | 1.8% | 2.3% | 4.9% |
| 10 Year Annual Average | 1.5% | 2.2% | 3.7% |
| 20 Year Annual Average | 1.3% | 2.2% | 3.5% |
| Years with Inflation: '00 - '19 | 18 of 20 | 19 of 20 | 20 of 20 |
As seen in Figure 2, the 3, 5, 10 & 20 year average annual inflation rates for the RV inflation categories has been between 1 – 6% between 2000 & 2019.
Quantifying the Benefits of LIFO
LIFO provides tax savings by moving inflated inventory costs from the balance sheet to the income statement via cost of goods sold. In periods of inflation, the effect of reducing the ending inventory balance & increasing cost of goods sold results in lower net income & taxable income. The difference between a company’s ending inventory balance at cost & LIFO inventory balance is called the LIFO reserve. The annual change in the LIFO reserve from one period to the next is called LIFO expense (or income if there is deflation and/or substantial inventory liquidations). One common misconception is that LIFO is a one time benefit, but this is not the case. Similar to the going concern assumption, the LIFO reserve will exist in perpetuity and the annual change is calculated every year. The key takeaways regarding the benefits of LIFO are as follows:
- In periods of inflation, using LIFO will decrease ending inventory balance & increase cost of goods sold, which effectively will lower taxable income & create after-tax cash savings
- LIFO expense (income) represents the change in the current vs. prior period LIFO reserve & is the current year taxable income reduction amount (LIFO income occurs in periods with deflation which causes increased taxable income)
- The LIFO reserve represents the sum of the annual LIFO expense/income amounts accumulated since adopting LIFO. Said another way, the LIFO reserve is the cumulative taxable income reduction that has occurred since adopting LIFO & is the difference between the ending inventory balance for a LIFO vs. non-LIFO taxpayer. For example, a company with ending inventory balances that would have been $30 million under the FIFO method but was $25 million under the LIFO method, the LIFO reserve is calculated as follows: ending FIFO inventory balance – ending LIFO inventory balance = LIFO reserve. $30M FIFO balance – $25 million LIFO balance = $5 million LIFO reserve)
- The current period after-tax cash savings from LIFO can be calculated by taking the product of the current year LIFO expense (current vs. prior year change in LIFO reserve) & a company’s tax rate. For example, a company with current & prior period LIFO reserve balances of $2 & $1 million would have $1 million of current period LIFO expense. If their tax rate was 30%, the current period after-tax cash savings from LIFO would be $300,000.
- The cumulative after-tax cash savings from LIFO can be calculated by taking the product of the current year LIFO reserve & a company’s tax rate. For example, a company with a $10 million LIFO reserve & 30%, tax rate would have a cumulative after-tax cash savings from LIFO of $3 million (cumulative = from the first year LIFO was adopted through the last period closed).
The table & chart below is intended to show the taxable income reduction & after-tax cash savings that would have occurred over the past 20 years for a RV dealership using LIFO & the following assumptions:
- LIFO Election Scope – All inventories, including motor homes, travel trailers, camping trailers & parts
- Inventory Balance – $10 million for all periods
- Inflation Measurement Source – Bureau of Labor Statistics (BLS) Table 9 Producer Price Indexes (PPI)
- Inflation Categories & Product Mix: The following inflation categories & inventory balances were assigned based on the BLS weights of relative importance & are follows:
- Motor homes: 22%
- Travel trailers: 60%
- Camping trailers, campers, pick-up covers & parts: 18%
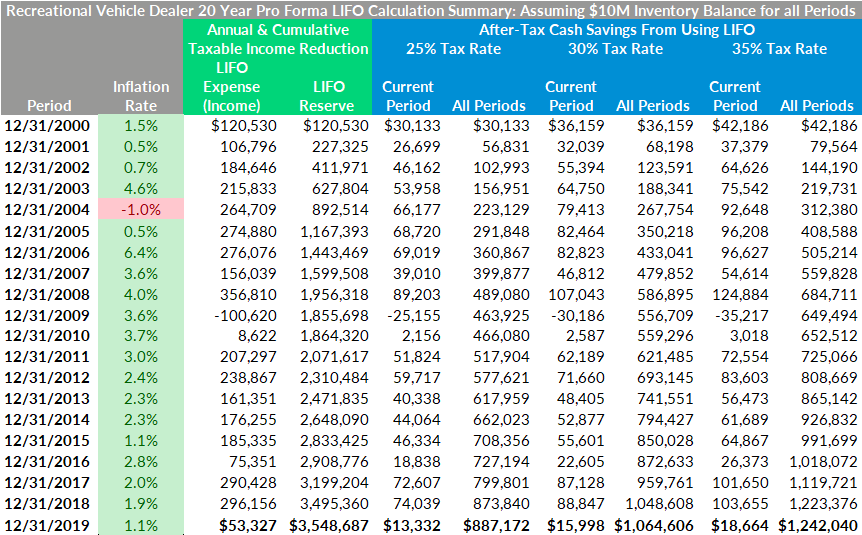
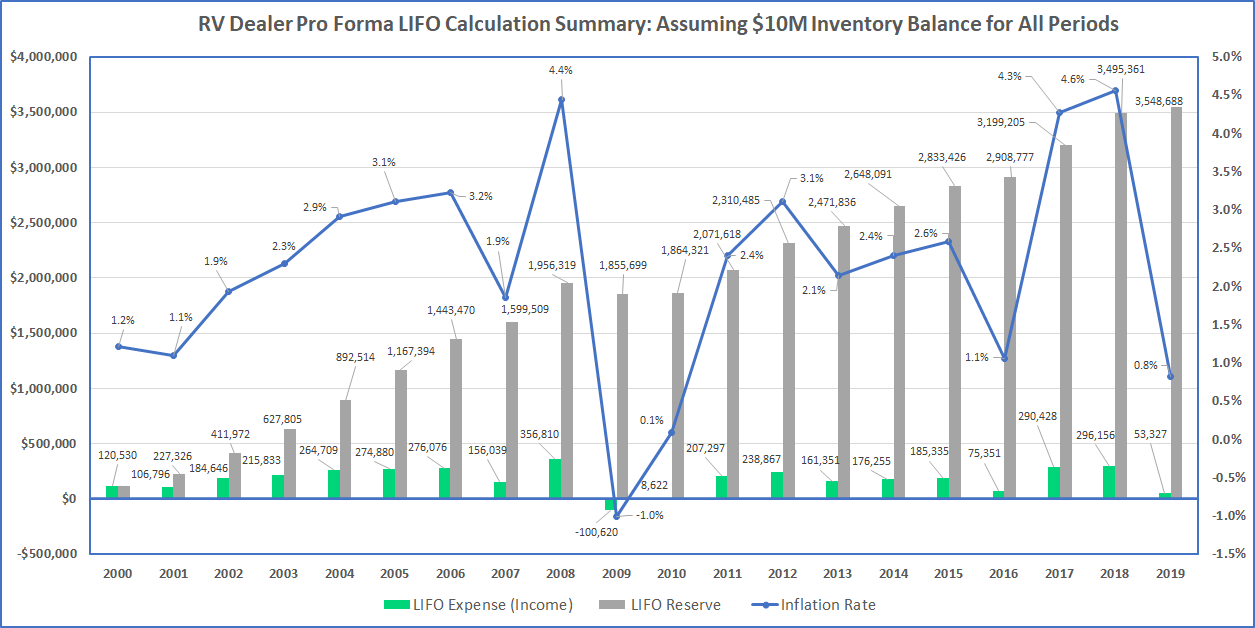
As seen in the chart above, the LIFO reserve accumulated over a 20-year period between 2000 – 2019 was over $3.5 million for a company with $10 million of inventory. The green bars represent the LIFO expense (income) which is the current year taxable income reduction & one year change in the LIFO reserve. The LIFO reserve bar shown in gray represents the cumulative taxable income reduction & the difference between a LIFO vs. non-LIFO taxpayer (i.e. FIFO, average cost, specific identification, etc.) As seen in the above chart, there is a direct correlation between the amount of current period inflation & resulting LIFO expense. As seen above, there was inflation in 19 of the 20 periods calculated, meaning taxable income was reduced in all but one year.
Weighing the Costs & Benefits of LIFO
Generally speaking, LIFO is extremely complex & calculation errors are extremely common when using spreadsheet-assisted manual procedures. With that being said, the overall complexity of LIFO for RV dealers is typically low compared to other industries such as manufacturers with multiple inputs & stages of production or a supermarket whom often will have tens of thousands of items. Because of this, the benefits of LIFO far outweigh the costs for RV dealerships. Furthermore, the availability of LIFO software & turnkey outsourcing solutions has lowered the barriers to entry for LIFO for many companies. The following means of completing LIFO calculations are employed by both RV dealers & other companies on LIFO:
- Outsource to a CPA firm or LIFO Calculation Service Provider
- In-house accounting staff completes calculation using LIFO software
- In-house accounting staff makes spreadsheet-assisted manual LIFO calculations
For many companies, utilizing a service provider or LIFO software to either outsource the calculation altogether or minimize the time & effort required to make LIFO calculations is a cost-effective strategy that reduces or eliminates the burdens related to using the LIFO method.
Get a Complimentary LIFO Election Benefit Analysis Today!
LIFOPro offers complimentary LIFO election benefit analysis for companies not on LIFO whom are seeking to determine the potential tax savings that could be achieved. Your analysis is delivered in the form of a report & includes the following:
- LIFO election recommendation detailing why LIFO should or should not be used
- Good LIFO candidate scoring criteria
- Pro forma LIFO calculation results
- Historical inflation summary
- How LIFO Works guide
Complete our simple, no obligation form online to get a complimentary analysis today!
Get a LIFO Election Benefit Analysis
Sample LIFO Election Benefit Analysis Report