Defining Good LIFO Candidates
When weighing the costs & benefits of using the LIFO method, the following factors are key in determining if a company is a good LIFO candidate
- Inflation rate – When working with companies to determine if they’re a good LIFO candidate, we look for a historical average annual inflation greater than or equal to 1%. For a company with $20 million of inventory, 1% inflation will typically represent about $200,000 of taxable income reduction & somewhere between $40K – $80K of after-tax cash savings in a single year. When accumulated over 10 years, this amount would now represent $2 million of taxable income reduction & $400K – $800K of after-tax cash savings.
- Inflation frequency – Consistent inflation reduces the occurrence of drastically changing LIFO benefits from one year to the next. It also prevents large taxable income increases from becoming a common occurrence such as those commonly seen in the oil & gas industry.
- Calculation costs – since the use of the LIFO inventory method is optional, the calculation complexity & costs often play a key role in determining if a company will ultimately want to use LIFO. Said another way, the less complex and/or costly it is to be on LIFO, the more likely it is that a company will both elect & stay on LIFO.
Heavy duty truck dealerships are good LIFO candidates for the following reasons:
- Heavy duty trucks have had historical average annual inflation of at least 1% or more over the past 20 years (see 3, 5, 10 & 20 year average annual inflation rates in Figure 1 below)
- Heavy duty trucks have had consistent price increases historically, with inflation measured in 19 of the past 20 years (for each of the 12 month periods ended December between 2000 – 2019; see the rates in Figure 2 below)
- The cost to obtain software or outsource LIFO calculations are minimal for heavy duty truck dealerships since the product mix is typically limited to a handful of items (trucks, trailers & parts)
- External inflation indexes can be used to calculate LIFO inflation, which avoids the need to have to develop internally calculated indexes using actual current & prior period costs
- The same heavy duty truck inflation category discussed below can be used for both new & used trucks
Figure 1 shown below provides the Bureau of Labor Statistics (BLS) Producer Price Index (PPI) historical inflation rates for truck tractors, truck trailers & parts:
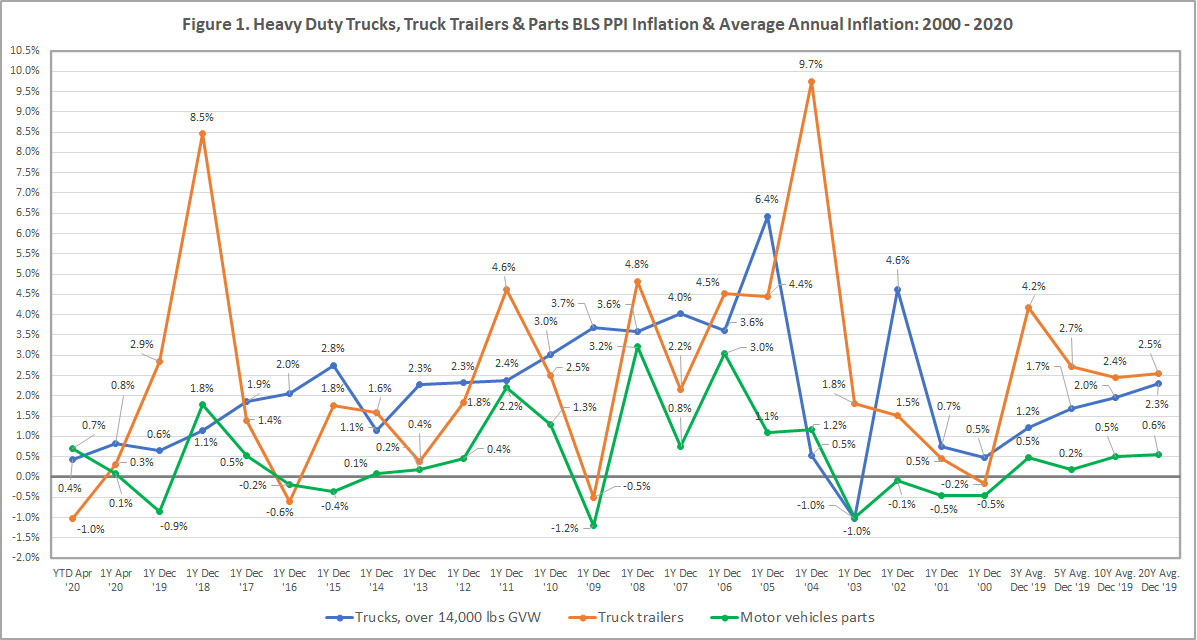
Figure 2. Heavy Duty Trucks, Trailers & Parts BLS PPI Inflation Rates & Frequency: 2000 – 2020
| BLS PPI Cat. Desc. / Period | Trucks, over 14,000 lbs GVW | Truck trailers | Motor vehicles parts |
|---|---|---|---|
| Year to Date Apr '19 | 0.4% | -1.0% | 0.7% |
| 12 Months Ended Apr '19 | 0.8% | 0.3% | 0.1% |
| 12 Months Ended Dec '19 | 1.1% | 8.5% | 1.8% |
| 12 Months Ended Dec '18 | 1.9% | 1.3% | 0.5% |
| 12 Months Ended Dec '17 | 2.0% | -0.6% | -0.2% |
| 12 Months Ended Dec '16 | 2.8% | 1.8% | -0.4% |
| 12 Months Ended Dec '15 | 1.1% | 1.6% | 0.1% |
| 12 Months Ended Dec '14 | 2.3% | 0.4% | 0.2% |
| 12 Months Ended Dec '13 | 2.3% | 1.8% | 0.5% |
| 12 Months Ended Dec '12 | 2.4% | 4.7% | 2.2% |
| 12 Months Ended Dec '11 | 3.0% | 2.5% | 1.2% |
| 12 Months Ended Dec '10 | 3.7% | -0.6% | -1.1% |
| 12 Months Ended Dec '09 | 3.6% | 4.8% | 3.1% |
| 12 Months Ended Dec '08 | 4.0% | 2.2% | 0.8% |
| 12 Months Ended Dec '07 | 3.6% | 4.6% | 3.1% |
| 12 Months Ended Dec '06 | 6.4% | 4.5% | 1.1% |
| 12 Months Ended Dec '05 | 0.5% | 9.7% | 1.2% |
| 12 Months Ended Dec '04 | -1.0% | 1.0% | -0.9% |
| 12 Months Ended Dec '03 | 4.6% | 0.3% | -0.1% |
| 12 Months Ended Dec '02 | 0.7% | -1.1% | -0.5% |
| 12 Months Ended Dec '01 | 0.5% | 1.5% | -0.4% |
| 12 Months Ended Dec '00 | 1.5% | 1.6% | -0.5% |
| 3 Year Average | 1.2% | 4.2% | 0.5% |
| 5 Year Average | 1.7% | 2.7% | 0.2% |
| 10 Year Average | 2.0% | 2.4% | 0.5% |
| 20 Year Average | 2.3% | 2.5% | 0.6% |
| Years with Inflation: '00 - '19 | 19 of 20 | 17 of 20 | 12 of 20 |
As seen in Figure 2, the 3, 5, 10 & 20 year average annual inflation rates for trucks & trailers has been between 1 – 4% between 2000 & 2019. Although the motor vehicle parts inflation rate is less than 1%, the weighted-average historical inflation for a truck dealership on LIFO will typically still be over 1% even if their parts inventories are on LIFO (election can be made selectively, meaning a company could decide to only use LIFO for equipment & not elect LIFO for parts).
Quantifying the Benefits of LIFO
LIFO provides tax savings by moving inflated inventory costs from the balance sheet to the income statement via cost of goods sold. In periods of inflation, the effect of reducing the ending inventory balance & increasing cost of goods sold results in lower net income & taxable income. The difference between a company’s ending inventory balance at cost & LIFO inventory balance is called the LIFO reserve. The annual change in the LIFO reserve from one period to the next is called LIFO expense (or income if there is deflation and/or substantial inventory liquidations). One common misconception is that LIFO is a one time benefit, but this is not the case. Similar to the going concern assumption, the LIFO reserve will exist in perpetuity and the annual change is calculated every year. The key takeaways regarding the benefits of LIFO are as follows:
- In periods of inflation, using LIFO will decrease ending inventory balance & increase cost of goods sold, which effectively will lower taxable income & create after-tax cash savings
- LIFO expense (income) represents the change in the current vs. prior period LIFO reserve & is the current year taxable income reduction amount (LIFO income occurs in periods with deflation which causes increased taxable income)
- The LIFO reserve represents the sum of the annual LIFO expense/income amounts accumulated since adopting LIFO. Said another way, the LIFO reserve is the cumulative taxable income reduction that has occurred since adopting LIFO & is the difference between the ending inventory balance for a LIFO vs. non-LIFO taxpayer. For example, a company with ending inventory balances that would have been $30 million under the FIFO method but was $25 million under the LIFO method, the LIFO reserve is calculated as follows: ending FIFO inventory balance – ending LIFO inventory balance = LIFO reserve. $30M FIFO balance – $25 million LIFO balance = $5 million LIFO reserve)
- The current period after-tax cash savings from LIFO can be calculated by taking the product of the current year LIFO expense (current vs. prior year change in LIFO reserve) & a company’s tax rate. For example, a company with current & prior period LIFO reserve balances of $2 & $1 million would have $1 million of current period LIFO expense. If their tax rate was 30%, the current period after-tax cash savings from LIFO would be $300,000.
- The cumulative after-tax cash savings from LIFO can be calculated by taking the product of the current year LIFO reserve & a company’s tax rate. For example, a company with a $10 million LIFO reserve & 30%, tax rate would have a cumulative after-tax cash savings from LIFO of $3 million (cumulative = from the first year LIFO was adopted through the last period closed).
The table & chart below is intended to show the taxable income reduction & after-tax cash savings that would have occurred over the past 20 years for a heavy duty truck dealership using LIFO & the following assumptions:
- LIFO Election Scope – New & Used Heavy duty trucks (no trailers or parts; same BLS PPI inflation category is used for new and used trucks)
- Inventory Balance – $25 million for all periods
- Inflation Measurement Source – Bureau of Labor Statistics (BLS) Table 9 Producer Price Indexes (PPI)
- Inflation Category – Trucks, over 14K lbs. GVW BLS PPI for the 12 months ended December for each of the 20 years shown (same trucks category shown in the above charts/tables)
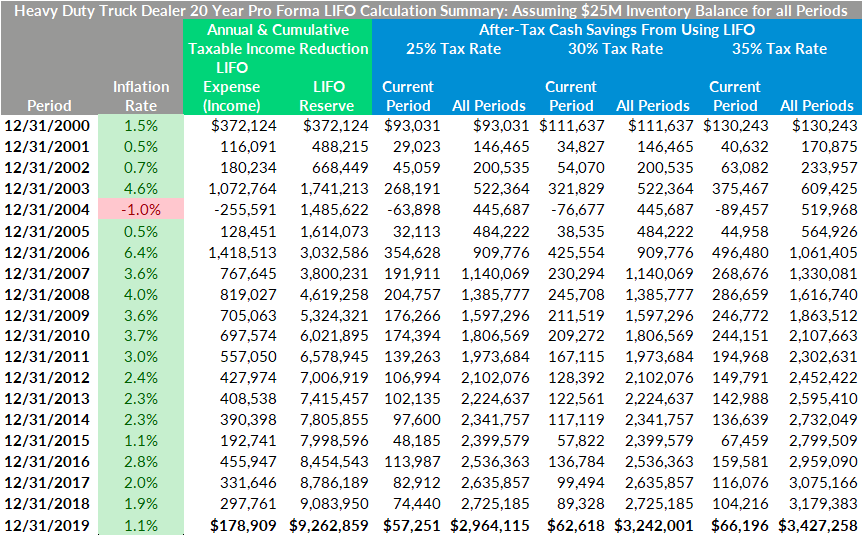
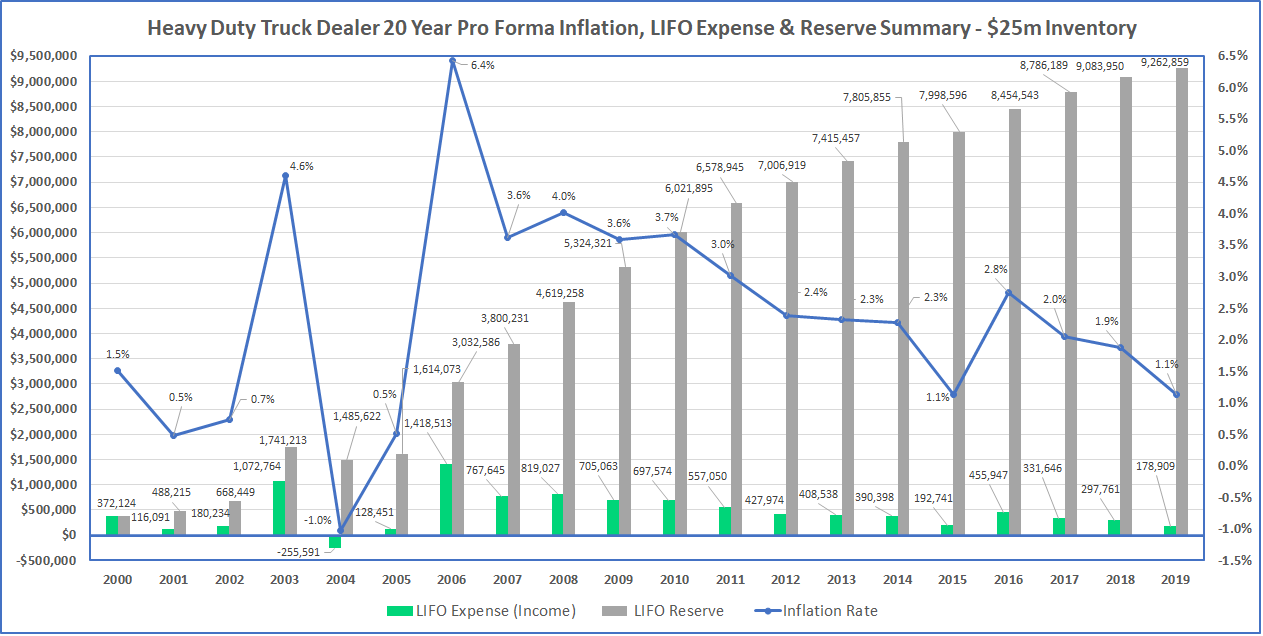
As seen in the chart above, the LIFO reserve accumulated over a 20-year period between 2000 – 2019 was over $9 million for a company with $25 million of inventory whom only had new & used trucks on LIFO & used BLS PPI inflation rates. The green bars represent the LIFO expense (income) which is the current year taxable income reduction & one year change in the LIFO reserve. The LIFO reserve bar shown in gray represents the cumulative taxable income reduction & the difference between a LIFO vs. non-LIFO taxpayer (i.e. FIFO, average cost, specific identification, etc.) As seen in the above chart, there is a direct correlation between the amount of current period inflation & resulting LIFO expense. As highlighted in Figure 2, there was inflation in 19 of the 20 periods for the BLS PPI heavy duty trucks category between 2000 – 2019. This means for a company that would have elected LIFO for the 2000 year end would have decreased taxable income in every year except for 2004.
Weighing the Costs & Benefits of LIFO
Generally speaking, LIFO is extremely complex & calculation errors are extremely common when using spreadsheet-assisted manual procedures. With that being said, the overall complexity of LIFO for heavy duty truck dealers is typically low compared to other industries such as manufacturers with multiple inputs & stages of production or a supermarket whom often will have tens of thousands of items. Because of this, the benefits of LIFO far outweigh the costs for heavy duty truck dealers. LIFOPro has dozens of equipment & machinery dealership clients as a result of it being one of the most ideal industries for LIFO. Furthermore, the availability of LIFO software & turnkey outsourcing solutions has lowered the barriers to entry for LIFO for many companies. The following means of completing LIFO calculations are employed by both heavy duty truck dealers & other companies on LIFO:
- Outsource to a CPA firm or LIFO Calculation Service Provider
- In-house accounting staff completes calculation using LIFO software
- In-house accounting staff makes spreadsheet-assisted manual LIFO calculations
For many companies, utilizing a service provider or LIFO software to either outsource the calculation altogether or minimize the time & effort required to make LIFO calculations is a cost-effective strategy that reduces or eliminates the burdens related to using the LIFO method.
Get a Complimentary LIFO Election Benefit Analysis Today!
LIFOPro offers complimentary LIFO election benefit analysis for companies not on LIFO whom are seeking to determine the potential tax savings that could be achieved. Your analysis is delivered in the form of a report & includes the following:
- LIFO election recommendation detailing if your company is a good LIFO candidate or not
- Good LIFO candidate scoring criteria
- Pro forma LIFO calculation results
- Historical inflation summary
- How LIFO Works guide to easily explain being a good LIFO candidate
Complete our simple, no obligation form online to get yours today!
Get a LIFO Election Benefit Analysis
Sample LIFO Election Benefit Analysis Report
Related Resources & Topics
How LIFO Works
LIFOPro's Offerings
LIFO Rules & Regulations
LIFO Rules & Regulations