The Bureau of Labor Statistics (BLS) released May 2021 Consumer Price Indexes (CPI) today. The all items index rose 0.8% in the last month and increased 5.0% in the last twelve months. Food at home increased 0.3% from April 2021 and rose by 0.7% since May 2020. Bacon, breakfast sausage and related products increased by 1.5% in the last month and increased 9.6% in the last twelve months. Canned fruits and vegetables increased 1.1% since April 2021 and saw an increase of 3.0% from May 2020. Energy commodities rose by 4.0% in the last month and jumped 54.5% in the last twelve months. Fuel oi and other fuels increased 0.5% from April 2021 and increased by 34.9% since May 2020. Commodities, less food and energy commodities, rose 1.5% in the last month and increased by 6.5% in the last twelve months. Household furnishings and supplies saw a rise of 0.9% since April 2021 and increased 3.7% from May 2020. Furniture and bedding rose 1.9% in the last month and increased 8.6% in the last twelve months. Appliances increased by 0.4% from April 2021 and rose 6.9% since May 2020. Apparel rose by 0.2% in the last month and increased 5.6% in the last twelve months. New vehicles rose 1.5% since April 2021 and increased 3.3% from May 2020. Used cars and trucks increased 6.5% in the last month and rose by 29.7% in the last twelve months. Sporting goods increased by 1.5% from April 2021 and rose 9.0% since May 2020.
BLS CPI Historical Annual Inflation Rate Averages Through May 2021
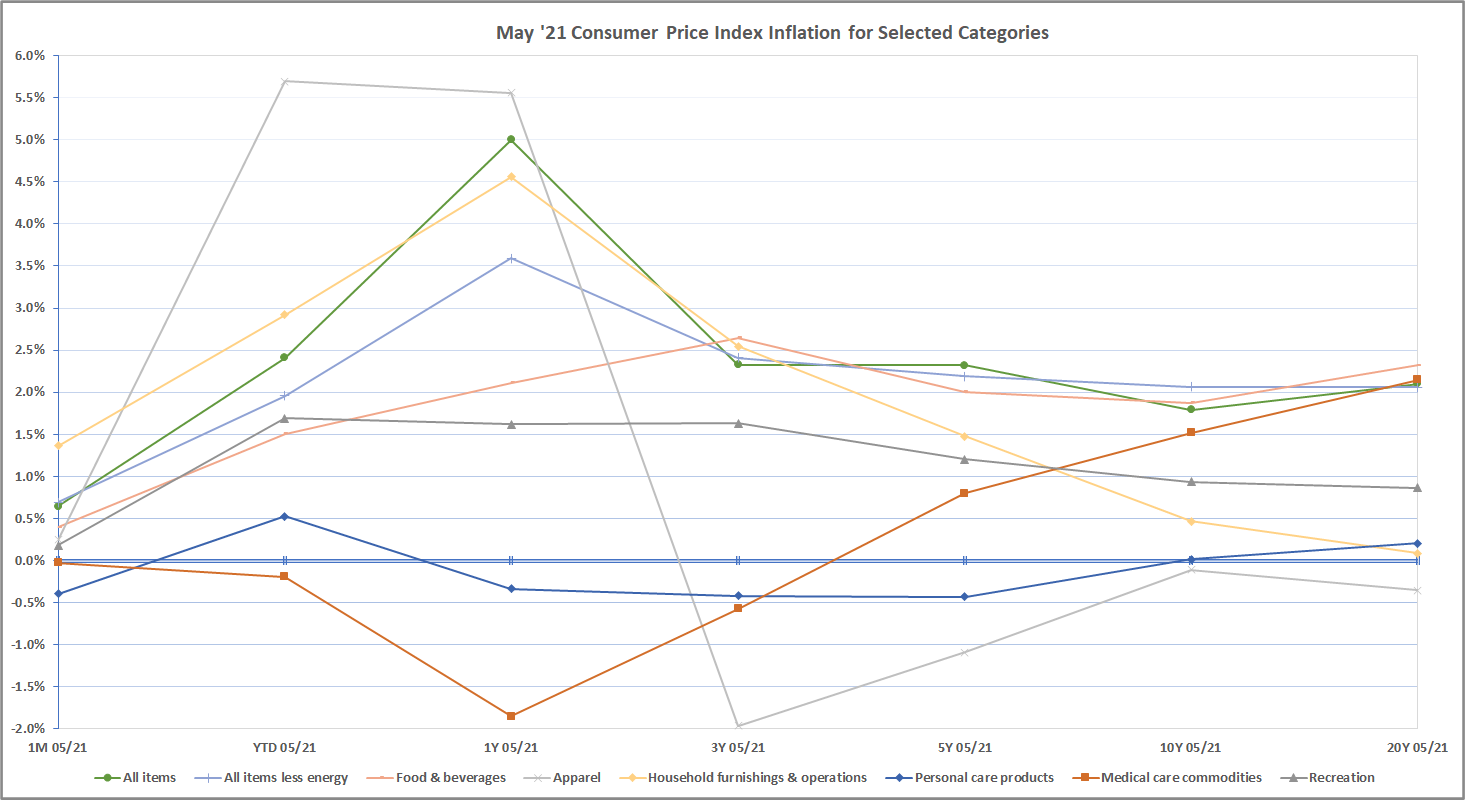
BLS CPI Historical Annual Inflation Rate Averages Through May 2021 Table For Selected Categories
| BLS CPI Code | BLS CPI Category Description | 1M 05/21 | YTD 05/21 | 1Y 05/21 | 3Y 05/21 | 5Y 05/21 | 10Y 05/21 | 20Y 05/21 |
|---|---|---|---|---|---|---|---|---|
| SAF | FOOD & BEVERAGES | 0.4% | 1.5% | 2.1% | 2.6% | 2.0% | 1.9% | 2.3% |
| SAF11 | Food at home | 0.3% | 1.7% | 0.7% | 2.2% | 1.3% | 1.3% | 2.0% |
| SAF114 | Nonalcoholic beverages & beverage materials | -1.0% | 0.2% | -0.2% | 2.2% | 1.3% | 0.7% | 1.3% |
| SEFN | Juices & nonalcoholic drinks | -1.5% | -0.3% | -0.6% | 2.9% | 1.8% | 1.1% | 1.4% |
| SEFN01 | Carbonated drinks | -2.1% | 0.0% | -0.6% | 3.3% | 2.1% | 1.3% | 1.8% |
| SEFN03 | Nonfrozen noncarbonated juices & drinks | -1.1% | -0.6% | -0.6% | 2.7% | 1.5% | 0.9% | 0.9% |
| SEFP | Beverage materials including coffee & tea | 0.4% | 1.4% | 0.7% | 0.7% | 0.0% | -0.3% | 1.1% |
| SEFP01 | Coffee | 0.8% | 2.4% | 1.4% | 0.2% | -0.5% | -0.8% | 1.5% |
| SEFP02 | Other beverage materials including tea | -0.3% | -0.4% | -0.6% | 1.4% | 0.8% | 0.6% | 1.0% |
| SAF115 | Other food at home | -0.2% | 0.5% | 0.3% | 1.5% | 0.9% | 1.1% | 1.6% |
| SEFT06 | Other miscellaneous foods | -0.5% | -1.0% | -0.5% | 1.6% | 0.9% | 1.1% | 1.2% |
| SEFW | Alcoholic beverages at home | 0.2% | 0.9% | 1.2% | 1.7% | 1.3% | 1.0% | 1.4% |
| SEFW01 | Beer, ale & other malt beverages at home | 0.7% | 0.9% | 0.4% | 2.4% | 2.0% | 1.7% | 2.1% |
| SEFW02 | Distilled spirits at home | 0.4% | 2.0% | 3.0% | 1.7% | 0.8% | 0.6% | 0.9% |
| SEFW03 | Wine at home | -0.2% | 0.6% | 1.2% | 1.0% | 0.7% | 0.3% | 0.7% |
| SEHE | FUEL OIL & OTHER FUELS | 0.5% | 14.3% | 34.9% | -0.5% | 5.0% | -1.9% | 3.9% |
| SAH3 | HOUSEHOLD FURNISHINGS & OPERATIONS | 1.4% | 2.9% | 4.6% | 2.5% | 1.5% | 0.5% | 0.1% |
| SAA | APPAREL | 0.2% | 5.7% | 5.6% | -2.0% | -1.1% | -0.1% | -0.4% |
| SAM1 | MEDICAL CARE COMMODITIES | 0.0% | -0.2% | -1.9% | -0.6% | 0.8% | 1.5% | 2.1% |
| SEMF | Medicinal drugs | -0.1% | -0.4% | -1.7% | -0.5% | 0.9% | 1.6% | |
| SEMF01 | Prescription drugs | -0.3% | -0.6% | -2.1% | -0.6% | 1.1% | 2.1% | 2.8% |
| SEMF02 | Nonprescription drugs | 0.7% | 0.3% | -0.3% | -0.3% | -0.2% | -0.3% | |
| SEMG | Medical equipment and supplies | 1.2% | 4.1% | -5.8% | -1.5% | -0.7% | -0.3% | |
| SAR | RECREATION | 0.2% | 1.7% | 1.6% | 1.6% | 1.2% | 0.9% | 0.9% |
| SEEA | EDUCATIONAL BOOKS & SUPPLIES | 0.7% | 0.7% | 2.1% | -1.0% | 0.7% | 2.8% | 4.4% |
| SEGA | TOBACCO & SMOKING PRODUCTS | 0.1% | 3.4% | 7.3% | 5.4% | 5.4% | 4.2% | 5.6% |
| SEGB | PERSONAL CARE PRODUCTS | -0.4% | 0.5% | -0.3% | -0.4% | -0.4% | 0.0% | 0.2% |
| SEGE | MISCELLANEOUS PERSONAL GOODS | -0.1% | 2.5% | -1.4% | -0.1% | -0.9% | -1.3% | -1.1% |
| SAG | OTHER GOODS AND SERVICES | -0.1% | 1.4% | 2.7% | 2.2% | 2.3% | 2.1% | 2.7% |
| SERE | Other recreational goods | -0.5% | 3.8% | 2.1% | -3.4% | -5.3% | -5.0% | -4.5% |
| SERG | Recreational reading materials | -0.6% | 0.9% | 3.8% | 3.8% | 2.8% | 2.3% | 1.8% |
CPI BLS Economic News Release BLS PPI Table 9 Detailed Report BLS PPI Table 11 Detailed Report Good LIFO Candidates