What’s Changed Since our Top 50 List was Published in October?
In October, we released a Top 50 LIFO candidates list that used inflation rates for the 9 months ended September 2019. As of last Wednesday, December 2019 Producer Price Indexes (PPI) were published and the books have now been closed on inflation rates for 2019. Over the past few days, we’ve crunched the numbers to identify the best opportunities for companies to reduce taxable income from using LIFO. Our complete list includes 200 PPI categories that are sure to provide great tax savings from LIFO both this year & in the long run.
2019 Inflation Highlights
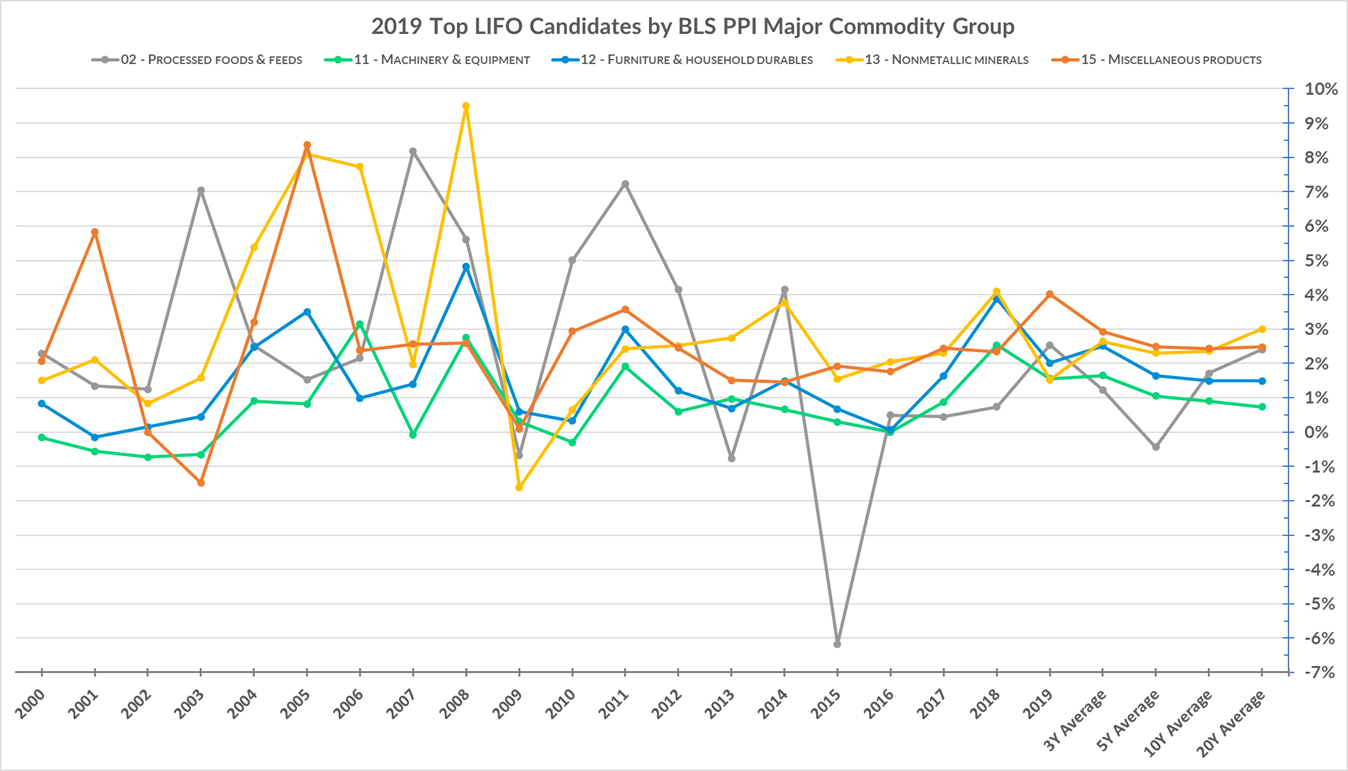
A wide range of opportunities are abound for companies looking to accumulating LIFO benefits starting this year. Of the 15 BLS major commodity groups, we’ve highlighted the top five in terms of the potential current & long-term LIFO benefits they provide below:
Processed Foods & Feeds
The 02 Processed foods & feeds BLS major commodity group represents commodities carried by supermarkets, grocery stores, alcohol distributors/wholesalers, food manufacturers & wholesalers. It is estimated that over 60% of grocery store chains use LIFO, and a large percentage of our client-base have product mixes that are composed of items falling within the 02 Processed foods & feeds category. Notable inflation rates for the 3-digit categories within the Processed foods & feeds group for the 12 months ended Dec. ’19 are shown below:
- 02 – Processed foods & feeds: 2.5%
- 022 – Meats: 5.6%
- 023 – Dairy: 7.7%
- 025 – Sugar & confectionary products: 3.5%
- 026 – Beverage & beverage materials: 1.7%
Machinery & Equipment
The 11 Machinery & equipment group represents another large pool of items that make up predominant portions of a large number of LIFO taxpayers product mixes. A large percentage of ag, farm & construction equipment dealerships are on LIFO, and most of the publicly traded manufacturers of these types of products are as well, including Deere, Case New Holland & Caterpillar. One of the primary reasons for this is that the categories within this group have provided some of the most consistent long-term inflation rates. Seven of the eight three-digit 11 categories listed above have had inflation in at least 17 or more of the past 20 years. Between 2000 – 2019, the 111 Ag machinery & equipment category has measured inflation in all 20 years and has maintained a 3/5/10/20 year average annual inflation rate of between 1.8% – 2.4%. The 112 Construction machinery & equipment category has had inflation in 19 of the prior 20 years since 2000 & has maintained a 3/5/10/20 year average annual inflation rate of between 1.7% – 2.3%. Notable inflation rates for the 3-digit categories within the Machinery & equipment group for the 12 months ended Dec. ’19 are shown below:
- 11 – Machinery & equipment: 1.6%
- 111 – Agricultural machinery & equipment: 2.3%
- 112 – Construction machinery & equipment: 2.2%
- 113 – Metalworking machinery & equipment: 1.3%
- 114 – General purpose machinery & equipment: 2.3%
- 116 – Special industry machinery & equipment: 2.0%
- 117 – Electrical machinery & equipment: 1.7%
- 118 – Miscellaneous instruments: 2.1%
- 119 – Miscellaneous machinery: 1.5%
Furniture & Household Durables
The 12 Furniture & household durables group frequently ranks near or at the top of the 15 BLS major commodity groups in terms of consistent inflation. Since 2000, this category has measured inflation in 19 of the past 20 years and the 3/5/10/20 year average annual inflation range between 1.5% – 2.5% as of the December 2019 year end. A large number of furniture manufacturers, wholesalers & retailers are on LIFO thanks to the 121 & 122 PPI inflation. The 121 Household furniture category’s 3/5/10/20 year average annual inflation rates through 2019 have ranged between 1.9% – 2.6% & the 122 Commercial furniture category has been between 1.9% – 3.2%. Both of the furniture 3-digit categories have had inflation in 18 or more of the past 20 years between 2000 – 2019. Notable inflation rates for the 3-digit categories within the Furniture & household durables group for the 12 months ended Dec. ’19 are shown below:
- 12 – Furniture & household durables: 2.0%
- 121 – Household furniture: 2.2%
- 122 – Commercial furniture: 2.5%
- 126 – Other household durable goods: 1.3%
Nonmetallic Mineral Products
The 13 Nonmetallic mineral products group houses BLS categories with some of the highest and most consistent inflation. Since 2000, this category has measured inflation in 19 of the past 20 years and the 3/5/10/20 year average annual inflation rates have been between 2.3% – 3% through 2019. Notable inflation rates for the 3-digit categories within the Nonmetallic mineral products group for the 12 months ended Dec. ’19 are shown below:
- 13 – Nonmetallic mineral products: 1.5%
- 131 – Glass: 1.4%
- 132 – Concrete ingredients & related products: 3.3%
- 133 – Concrete products: 2.7%
- 134 – Clay construction products excluding refractories: 1.3%
- 135 – Refractories: 5.3%
- 138 – Glass containers: 2.7%
Miscellaneous Products
The 15 Miscellaneous products group includes a wide range of BLS categories that mainstays in terms of consistent inflation. Five of the seven Miscellaneous products categories listed above have had inflation in 17 or more of the past 20 years since 2000, and both the 154 Photographic equipment and supplies and 155 Mobile homes categories have had inflation in all 20 years since 2000. A vast majority of the companies that are on LIFO include tobacco as a part of their LIFO election scope because it has some of the highest & most consistent historical inflation. Notable inflation rates for the 3-digit categories within the Miscellaneous products group for the 12 months ended Dec. ’19 are shown below:
- 15 – Miscellaneous products: 4.0%
- 151 – Toys, sporting goods, small arms, etc.: 4.6%
- 152 – Tobacco products, incl. stemmed & redried: 6.1%
- 153 – Notions: 1.5%
- 154 – Photographic equipment & supplies: 7.1%
- 155 – Mobile homes: 8.7%
- 156 – Medical, surgical & personal aid devices: 1.4%
- 159 – Other miscellaneous products: 5.6%
Top LIFO Candidates List Criteria
The criteria for being included in the list below is as follows:
- 1.5% or greater current year PPI inflation rate for the 12 months ended December 2019 (December 2019 ÷ December 2018)
- Inflation frequency rate of greater than or equal to 60% (15 or more of 20 periods measured with inflation between 2000 – 2019)
- Three of the four historical average annual inflation rates must be 1% or greater (historical rates are the 3/5/10/20 year percentages shown below*)
2019 Top LIFO Candidates List
| PPI Code | PPI Category Description | 1Y Dec. '19 | 1Y Dec. '18 | 3Y Avg. | 5Y Avg. | 10Y Avg. | 20Y Avg. | # Years Indexes Published '00 - '19 | # Yrs Inflation '00 - '19 | Inflation Freq. Rate '00 - '19 |
|---|---|---|---|---|---|---|---|---|---|---|
| 02 | Processed foods & feeds | 2.5% | 0.7% | 1.2% | -0.4% | 1.7% | 2.4% | 20 | 17 | 85% |
| 021130 | Retail bakery products | 3.0% | 7.1% | 4.2% | 4.3% | - | - | 5 | 5 | 100% |
| 0221 | Meats | 5.7% | 0.7% | 2.1% | -2.7% | 3.3% | 2.7% | 20 | 14 | 70% |
| 02210126 | Beef, fresh/frozen variety meats, not canned or made into sausage, made in slaughtering plants | 4.8% | 1.4% | 4.1% | -6.2% | 4.3% | - | 11 | 8 | 73% |
| 02210503 | Fresh/processed sausage, deli & cooked meats, etc. | 2.7% | -0.7% | 2.4% | 0.3% | 3.1% | - | 18 | 12 | 67% |
| 02210579 | Canned meats, excluding dog, cat & baby food | 21.3% | -0.2% | 7.7% | 4.1% | 3.0% | 2.7% | 20 | 15 | 75% |
| 0223 | Unprocessed and prepared seafood | 6.6% | 1.0% | 1.3% | 2.5% | 3.5% | 3.1% | 20 | 15 | 75% |
| 022304 | Canned seafood (including soups, stews & chowders) | 11.8% | 15.7% | 12.6% | 8.4% | 5.6% | 4.4% | 19 | 14 | 74% |
| 0234 | Ice cream and frozen desserts | 2.8% | 0.8% | 2.0% | 1.2% | 2.3% | 2.3% | 20 | 18 | 90% |
| 0244 | Canned vegetables and juices | 3.5% | 4.7% | 3.2% | 0.8% | 0.8% | 2.0% | 20 | 16 | 80% |
| 0245 | Frozen vegetables | 1.8% | 2.4% | 3.2% | 2.1% | 1.8% | 2.7% | 20 | 18 | 90% |
| 025 | Sugar and confectionery | 3.5% | 1.1% | 1.5% | 1.1% | 1.4% | 2.7% | 20 | 16 | 80% |
| 0254 | Confectionery materials | 7.4% | 0.1% | 3.2% | 2.7% | -0.1% | 3.4% | 20 | 15 | 75% |
| 0255 | Confectionery end products | 2.2% | 1.7% | 0.8% | 0.6% | 2.1% | 2.6% | 20 | 16 | 80% |
| 025503 | Candy and nuts | 2.4% | 1.4% | 0.7% | 0.5% | 2.3% | 2.6% | 20 | 17 | 85% |
| 02550301 | Chocolate and chocolate-type confectionery products | 3.9% | 1.3% | 2.1% | 1.6% | 2.2% | 2.8% | 20 | 20 | 100% |
| 02550302 | Nonchocolate-type confectionery products | 1.7% | 4.0% | 2.1% | 1.7% | 1.7% | 2.1% | 20 | 19 | 95% |
| 026 | Beverages and beverage materials | 1.7% | 1.7% | 1.4% | 1.3% | 1.5% | 2.1% | 20 | 20 | 100% |
| 02610101 | Bottled beer and ale | 1.5% | 1.8% | 1.5% | 1.5% | 2.0% | 2.0% | 20 | 19 | 95% |
| 02610105 | Beer and ale in barrels and kegs | 3.7% | 1.7% | 2.2% | 2.1% | 3.0% | 3.7% | 20 | 19 | 95% |
| 0262 | Soft drinks | 3.8% | 1.9% | 1.9% | 2.0% | 1.7% | 2.2% | 20 | 20 | 100% |
| 0264 | Other beverage materials | 3.3% | 2.8% | 2.3% | 2.1% | 1.6% | 2.4% | 20 | 18 | 90% |
| 0289015411 | Soft drink flavoring syrup, sold in bulk | 4.0% | 3.5% | 3.5% | 4.0% | - | - | 8 | 6 | 75% |
| 02890162 | Dairy product substitutes | 3.7% | 2.1% | 0.9% | 0.9% | 1.3% | 1.9% | 20 | 16 | 80% |
| 029402 | Pet food | 3.1% | 3.4% | 1.8% | 1.5% | 2.1% | 3.0% | 20 | 18 | 90% |
| 03460102 | Vinyl coated fabrics, including expanded vinyl coated | 2.3% | 4.7% | 3.4% | 2.0% | 1.8% | 2.4% | 20 | 14 | 70% |
| 0347 | Screen printed textile materials, embroideries & lace goods | 3.5% | 2.0% | 2.2% | 1.5% | 1.0% | 0.9% | 20 | 16 | 80% |
| 03810424 | Gloves & mittens, made from purchased materials | 5.5% | 2.8% | 3.1% | 2.3% | - | - | 8 | 8 | 100% |
| 03830345 | Canvas & related products | 4.9% | 2.7% | 3.1% | 2.3% | 2.4% | - | 16 | 14 | 88% |
| 043 | Footwear | 3.3% | 0.2% | 1.9% | 1.8% | 2.7% | 1.9% | 20 | 19 | 95% |
| 0576 | Finished lubricants | 2.5% | 7.5% | 4.6% | 1.8% | 3.4% | 5.8% | 20 | 14 | 70% |
| 057604 | Lubricating & similar oils | 2.6% | 7.8% | 4.7% | 1.8% | 3.6% | 5.9% | 20 | 14 | 70% |
| 0621 | Prepared paint | 2.6% | 6.0% | 3.5% | 1.7% | 2.5% | 3.3% | 20 | 18 | 90% |
| 062101 | Architectural coatings | 3.7% | 8.1% | 4.5% | 2.3% | 2.6% | 3.8% | 20 | 16 | 80% |
| 06210301 | Special purpose coatings, incl. marine, industrial & construction coatings | 2.4% | 7.3% | 4.2% | 2.2% | 2.8% | 3.7% | 20 | 17 | 85% |
| 0622 | Paint materials | 5.3% | 3.2% | 4.2% | 0.5% | 2.0% | 3.1% | 20 | 15 | 75% |
| 0637 | Biological products, including diagnostics | 3.6% | 2.2% | 1.6% | 2.0% | 2.2% | 2.5% | 20 | 17 | 85% |
| 0653 | Other agricultural chemicals | 4.5% | 4.3% | 2.9% | 1.1% | 0.5% | 1.5% | 20 | 14 | 70% |
| 06710401 | Soaps & detergents, commercial, industrial & institutional | 2.2% | 1.6% | 1.8% | 1.8% | 1.9% | 2.5% | 20 | 19 | 95% |
| 0672 | Polish & other sanitation goods | 4.0% | 6.9% | 4.8% | 3.0% | 1.8% | 2.0% | 20 | 17 | 85% |
| 06750504 | Dentifrices, mouthwashes, gargles & rinses | 11.8% | 0.3% | 3.7% | 2.8% | - | - | 8 | 6 | 75% |
| 067903 | Industrial gases | 11.5% | -0.4% | 5.1% | 5.3% | 4.3% | 3.4% | 20 | 15 | 75% |
| 0679040A | Nonstructural caulking compounds & sealants | 2.3% | 5.9% | 3.9% | 3.0% | - | - | 8 | 6 | 75% |
| 071303 | Rubber & plastic belts & belting | 3.3% | 1.8% | 4.5% | 2.7% | 4.3% | 3.5% | 20 | 16 | 80% |
| 07130371 | Flat rubber & plastics belts & belting | 4.2% | 0.9% | 5.3% | 3.0% | 5.8% | - | 16 | 12 | 75% |
| 071304 | Rubber & plastics hose | 2.8% | 4.2% | 2.6% | 1.6% | 2.3% | 3.0% | 20 | 18 | 90% |
| 07130616 | Rubber druggist & medical sundries, excluding gloves | 5.1% | 0.9% | 3.1% | 2.4% | 2.1% | - | 16 | 14 | 88% |
| 07130618 | Rubber coated fabrics & garments | 2.6% | 3.3% | 2.3% | 1.7% | 2.5% | - | 12 | 12 | 100% |
| 07210604 | Plastics pipe fittings & unions | 2.4% | 8.6% | 6.0% | 4.3% | 4.2% | - | 13 | 12 | 92% |
| 072602054 | Industrial machinery plastics products, excl foam (incl gears, bearings, bushings, cams) | 16.9% | 2.9% | 6.6% | 4.1% | - | - | 6 | 5 | 67% |
| 07290198 | Products made of foam other than polystyrene or polyurethane | 2.6% | 1.7% | 2.5% | 1.6% | 1.6% | - | 19 | 13 | 68% |
| 08210112 | Wood window units | 6.0% | 4.0% | 4.1% | 3.6% | 3.5% | 2.7% | 20 | 19 | 95% |
| 08410101 | Wood pallets & pallet containers, wood & metal combination | 4.0% | 8.8% | 5.5% | 2.9% | 3.7% | - | 10 | 8 | 80% |
| 08710101 | Wood poles, piles & posts owned & treated by the same establishment | 5.5% | 2.2% | 2.6% | 1.3% | 2.3% | 2.4% | 20 | 15 | 75% |
| 09150322 | Setup (rigid) paperboard boxes | 5.9% | 5.4% | 3.7% | 3.1% | 2.5% | 2.4% | 20 | 18 | 90% |
| 091507 | Fiber cans, tubes & similar fiber products | 1.6% | 4.0% | 5.0% | 3.4% | 2.5% | 2.6% | 20 | 17 | 85% |
| 094 | Publications, printed matter & printing material | 2.6% | 2.2% | 1.8% | 1.1% | 0.9% | - | 10 | 9 | 90% |
| 0945 | Manifold business forms printing | 3.2% | 6.8% | 4.1% | 2.6% | 2.9% | - | 12 | 10 | 75% |
| 09470205 | Label & wrapper printing (flexographic) | 1.8% | 4.4% | 2.4% | 1.4% | 1.2% | - | 11 | 9 | 82% |
| 10150227 | Soil pipe & fittings, cast iron | 4.9% | 12.4% | 3.0% | 2.5% | - | - | 8 | 6 | 75% |
| 104101 | Builders' hardware | 1.7% | 3.0% | 2.3% | 1.6% | 2.0% | 2.5% | 20 | 16 | 80% |
| 10410341 | Other transportation equipment hardware, incl. marine & aircraft (excl. motor vehicle hardware) | 1.8% | 1.1% | 2.0% | 1.6% | 1.4% | 2.7% | 20 | 18 | 90% |
| 1042 | Hand & edge tools | 2.5% | 2.6% | 2.2% | 1.5% | 1.3% | 1.9% | 20 | 18 | 90% |
| 10420145 | Edge tools, hand operated | 7.5% | 1.1% | 3.1% | 2.3% | 2.3% | - | 12 | 11 | 92% |
| 105 | Plumbing fixtures & fittings | 3.2% | 4.6% | 3.3% | 2.3% | 2.2% | 2.4% | 20 | 20 | 100% |
| 10540211 | Bath & shower fittings | 2.4% | 8.8% | 4.2% | 2.8% | 2.7% | 2.0% | 19 | 15 | 79% |
| 10540218 | Lavatory & sink fittings | 4.4% | 6.3% | - | 3.1% | 2.5% | 2.4% | 19 | 17 | 89% |
| 1056 | Enameled iron & metal sanitary ware | 3.5% | 1.6% | 2.2% | 1.5% | 2.1% | 3.1% | 19 | 16 | 84% |
| 106 | Heating equipment | 4.4% | 5.3% | 3.9% | 3.0% | 2.7% | 3.1% | 20 | 20 | 100% |
| 106101 | Steam & hot water equipment | 2.2% | 3.4% | 2.6% | 1.6% | 2.3% | 3.4% | 20 | 19 | 95% |
| 1062 | Furnaces & heaters, including parts | 7.6% | 5.3% | 4.5% | 2.8% | 2.4% | 2.2% | 20 | 17 | 85% |
| 1064 | Domestic heating stoves | 2.4% | 1.6% | 2.7% | 2.5% | 2.2% | 2.6% | 20 | 16 | 80% |
| 1066 | Domestic water heaters | 2.4% | 8.4% | 4.2% | 4.1% | 3.4% | 5.2% | 20 | 17 | 85% |
| 1071 | Metal doors, sash & trim | 1.7% | 6.9% | 4.3% | 3.4% | 2.7% | 2.6% | 20 | 18 | 90% |
| 1075 | Heat exchangers & steam condensers | 3.0% | 5.9% | 3.3% | 2.8% | 2.7% | 3.2% | 20 | 18 | 90% |
| 107902 | Farm service buildings & other prefabricated & portable buildings, steel & aluminum | 2.7% | 7.5% | 3.8% | - | 2.6% | 4.7% | 17 | 14 | 82% |
| 1081 | Bolts, nuts, screws, rivets & washers | 4.9% | 4.5% | 3.2% | 2.2% | 1.9% | 2.5% | 20 | 16 | 80% |
| 1083 | Lighting fixtures | 2.8% | 5.5% | 3.2% | 2.3% | 1.8% | 1.6% | 20 | 19 | 95% |
| 11 | Machinery & equipment | 1.6% | 2.5% | 1.7% | 1.0% | 0.9% | 0.7% | 20 | 13 | 65% |
| 111 | Agricultural machinery & equipment | 2.3% | 3.5% | 2.2% | 1.8% | 1.8% | 2.4% | 20 | 20 | 100% |
| 111401 | Commercial turf & grounds care equipment, including parts & attachments | 2.3% | 2.9% | 1.6% | 1.1% | 1.0% | - | 17 | 15 | 88% |
| 11140611 | Harvesting machinery (except hay & straw) & attachments | 6.0% | 3.4% | 3.3% | 2.8% | 2.3% | - | 17 | 16 | 94% |
| 111407 | Haying machinery & attachments | 3.8% | 4.3% | 2.5% | 2.2% | 2.5% | - | 17 | 16 | 94% |
| 112 | Construction machinery & equipment | 2.2% | 3.4% | 2.2% | 1.7% | 2.0% | 2.3% | 20 | 19 | 95% |
| 112A | Tractors & attachments, ex. parts | 3.7% | 3.8% | 2.7% | 1.9% | 2.2% | - | 19 | 18 | 95% |
| 112B | Power cranes, draglines, & shovels (excavators) (incl. surface mining equipment) (excl. parts) | 1.7% | 2.1% | 1.7% | 1.3% | 1.5% | - | 19 | 17 | 89% |
| 112C | Mixers, pavers & related equipment (excluding parts) | 3.3% | 7.7% | 3.9% | 3.0% | 2.4% | - | 19 | 16 | 84% |
| 112D | Off-highway, equipment, ex. parts | 1.9% | 1.9% | 1.4% | 1.4% | 2.4% | - | 19 | 19 | 100% |
| 1132 | Power-driven handtools, including parts & attachments | 1.7% | 1.1% | 1.4% | 1.8% | 1.6% | 1.2% | 20 | 17 | 85% |
| 1133 | Welding machines & equipment | 1.6% | 5.7% | 3.5% | 2.6% | 2.6% | 3.2% | 20 | 19 | 95% |
| 113301 | Arc welding machines, components & accessories, excluding electrodes & stud welding equip | 3.0% | 7.9% | 4.9% | 3.9% | 3.5% | 3.2% | 20 | 19 | 95% |
| 1134 | Industrial process furnaces & ovens | 2.6% | 2.5% | 2.0% | 1.6% | 1.5% | 1.7% | 20 | 19 | 95% |
| 113502 | Precision measuring tools | 3.3% | -1.4% | 0.8% | 1.1% | 1.1% | 1.5% | 19 | 16 | 84% |
| 1136 | Abrasive products | 2.8% | 2.3% | 2.3% | 1.8% | 2.0% | 2.1% | 20 | 19 | 95% |
| 1138 | Metal forming machine tools | 4.1% | 1.4% | 2.3% | 1.6% | 1.7% | 2.0% | 20 | 18 | 90% |
| 113826 | Metal-forming machine tools (except rebuilt & parts) | 4.4% | 1.4% | 2.2% | 1.4% | 1.7% | - | 10 | 9 | 90% |
| 11390312 | Industrial injection-type molds made of metal for plastics | 3.3% | 2.9% | 2.0% | 1.2% | 1.6% | - | 10 | 8 | 80% |
| 114 | General purpose machinery & equipment | 2.3% | 4.2% | 2.8% | 2.1% | 2.2% | 2.6% | 20 | 20 | 100% |
| 114102 | Industrial pumps, except hydraulic fluid power pumps | 3.8% | 3.9% | 3.4% | 2.7% | 1.8% | 2.6% | 20 | 19 | 95% |
| 11411501 | Air & gas compressors & vacuum pumps | 3.2% | 7.3% | 4.4% | 2.7% | 3.2% | - | 14 | 13 | 93% |
| 1142 | Elevators, escalators & other lifts | 4.3% | 2.6% | 3.2% | 2.5% | 1.9% | 1.6% | 20 | 16 | 80% |
| 114201 | Elevators & moving stairways | 3.9% | 2.9% | 3.4% | 2.5% | 2.0% | 1.5% | 20 | 15 | 75% |
| 114202 | Parts & attachments for elevators & moving stairs (sold separately) | 5.5% | 1.6% | 1.8% | 2.1% | 1.2% | 1.9% | 20 | 16 | 80% |
| 1143 | Fluid power equipment | 2.3% | 3.0% | 2.4% | 1.9% | 2.1% | 2.7% | 20 | 20 | 100% |
| 114302 | Fluid power valves | 2.4% | 1.6% | 1.9% | 2.4% | 2.5% | 3.0% | 20 | 20 | 100% |
| 114302014 | Nonaerospace type hydraulic valves, except directional control | 3.1% | 2.8% | 2.0% | 1.3% | 2.0% | - | 10 | 10 | 100% |
| 11430201A | Aerospace type fluid power valves | 2.0% | 1.2% | 1.8% | 3.1% | - | - | 9 | 9 | 100% |
| 114303 | Fluid power cylinders, actuators, accumulators, cushions, & parts | 2.9% | 3.7% | 3.1% | 2.1% | 1.9% | 2.4% | 20 | 20 | 100% |
| 114402 | Conveying equipment, except parts & accessories | 2.3% | 3.6% | 2.5% | 1.8% | 1.9% | 2.4% | 20 | 17 | 85% |
| 11440212 | Unit handling conveyors & conveying systems | 2.4% | 2.8% | 2.3% | 1.6% | 1.9% | 2.1% | 20 | 16 | 80% |
| 11440216 | Bulk material handling conveyors & conveying systems | 2.2% | 4.4% | 3.0% | 2.2% | 1.6% | 2.3% | 20 | 19 | 95% |
| 11440358 | Bulk powered material moving equipment, dock boards & metal pallets & skids | 2.3% | 12.9% | 4.9% | 3.0% | 2.4% | - | 17 | 15 | 88% |
| 11440481 | Hoists | 2.6% | - | - | 2.1% | 2.3% | 2.9% | 15 | 12 | 80% |
| 11440485 | Overhead traveling cranes & monorail systems | 4.1% | 6.6% | 3.8% | 3.5% | 2.8% | 2.7% | 20 | 18 | 90% |
| 1145 | Mechanical power transmission equipment | 1.7% | 4.3% | 2.5% | 1.7% | 2.0% | 2.8% | 20 | 18 | 90% |
| 1147 | Air purification equipment & industrial & commercial fans & blowers | 3.4% | 4.6% | 3.0% | 2.2% | 2.3% | 2.4% | 20 | 19 | 95% |
| 114701 | Fan, blower, air purification equipment | 3.4% | 4.6% | 3.0% | 2.2% | 2.3% | 2.4% | 20 | 19 | 95% |
| 1148 | Air conditioning & refrigeration equip | 3.1% | 5.2% | 3.4% | 2.4% | 2.1% | 2.0% | 20 | 18 | 90% |
| 114802 | Unitary air-conditioners, except air source heat pumps | 7.6% | 6.4% | 5.5% | 3.2% | 2.3% | 2.0% | 20 | 15 | 75% |
| 11480331 | Commercial refrigeration equipment | 1.8% | 1.3% | 1.5% | 2.1% | 2.3% | - | 16 | 15 | 94% |
| 114807 | Heat transfer equipment, including heat pumps | 1.7% | 6.6% | 3.2% | 2.3% | - | - | 8 | 8 | 100% |
| 1149 | Miscellaneous general purpose equipment | 2.8% | 3.7% | 2.9% | 2.0% | 2.5% | 2.8% | 20 | 20 | 100% |
| 114902 | Metal valves, except fluid power | 1.8% | 5.7% | 3.4% | 2.8% | 3.4% | 3.8% | 20 | 20 | 100% |
| 11490208 | Solenoid valves | 1.8% | 5.8% | - | 3.1% | - | 4.1% | 18 | 16 | 83% |
| 114905 | Ball & roller bearings | 5.3% | 4.1% | 3.6% | 2.1% | 2.4% | 2.7% | 20 | 18 | 90% |
| 114907 | Industrial patterns | 2.8% | - | - | 2.0% | 2.3% | 2.1% | 17 | 12 | 71% |
| 116 | Special industry machinery & equipment | 2.0% | 2.1% | 1.7% | 1.4% | 1.2% | 1.4% | 20 | 19 | 95% |
| 1161 | Food products machinery | 2.2% | 3.7% | 2.5% | 2.1% | 2.3% | 2.7% | 20 | 20 | 100% |
| 11610501 | Industrial food products machinery for processing foods, beverages, & animal & fowl feed | 3.1% | 2.3% | 2.6% | 2.5% | 2.9% | 3.2% | 20 | 19 | 95% |
| 1164 | Paper industries machinery | 2.4% | 1.7% | 1.4% | 1.1% | 1.7% | 1.7% | 20 | 20 | 100% |
| 1169 | Commercial laundry & drycleaning machinery products | 3.1% | 3.2% | 2.7% | 2.1% | 1.9% | 2.7% | 20 | 20 | 100% |
| 1171 | Wiring devices | 1.9% | 2.0% | 1.7% | 0.7% | 1.4% | 2.2% | 20 | 15 | 75% |
| 11710252 | Porcelain, steatite & other ceramic electrical products | 7.5% | 2.8% | 4.3% | 2.2% | 1.4% | - | 16 | 14 | 88% |
| 1175 | Switchgear, switchboard, industrial controls equipment | 2.4% | 2.4% | 2.1% | 1.4% | 1.4% | 2.2% | 20 | 18 | 90% |
| 117507992 | Parts for industrial controls & motor-control accessories | 3.2% | 2.3% | 2.9% | 2.2% | - | - | 8 | 8 | 100% |
| 11782299 | Switches, mechanical (electronic applications) | 5.0% | 2.1% | 2.9% | 2.0% | 1.6% | 1.6% | 19 | 16 | 84% |
| 117824 | Connectors for electronic circuitry | 1.8% | 2.6% | 2.3% | 1.3% | 1.9% | 1.5% | 20 | 18 | 90% |
| 11785399 | Electronic coils, transformers & other inductors | 1.9% | 1.6% | 1.6% | 1.3% | 1.3% | - | 19 | 16 | 84% |
| 11792902 | Rectifying apparatus | 2.4% | 3.0% | 2.9% | 2.5% | 1.8% | 1.6% | 20 | 17 | 85% |
| 1181 | Automatic environmental controls for monitoring residential, commercial & appliance use | 4.0% | 4.6% | 3.4% | 2.5% | 1.5% | 1.2% | 20 | 16 | 80% |
| 1184 | Fluid meters & counting devices | 2.7% | 3.7% | 2.8% | 2.3% | 2.8% | 2.5% | 20 | 19 | 95% |
| 1185 | Engineering & scientific instruments | 2.7% | 2.3% | 2.8% | 2.5% | 2.0% | 2.1% | 20 | 19 | 95% |
| 11850111 | Aeronautical, nautical & navigational instruments | 4.3% | 3.6% | 4.4% | 3.4% | 2.8% | 2.4% | 19 | 17 | 89% |
| 1186 | Measuring instruments & lenses | 2.1% | 1.0% | 1.7% | 1.5% | 1.1% | 1.2% | 20 | 19 | 95% |
| 118603 | Laboratory analytical instruments | 2.8% | 1.0% | 2.2% | 1.9% | 1.4% | 1.5% | 20 | 20 | 100% |
| 1189 | Measuring & controlling devices, n.e.c. | 2.8% | 0.9% | 1.8% | 1.6% | 1.2% | 1.0% | 20 | 16 | 80% |
| 118901 | Aircraft engine instruments | 5.8% | 1.6% | 3.6% | 3.4% | 1.8% | 1.2% | 19 | 15 | 79% |
| 118906 | Commercial, geophysical, meteorological & general-purpose instruments | 2.9% | 0.4% | 1.4% | 1.1% | 1.0% | - | 15 | 15 | 100% |
| 1192 | Mining machinery & equipment | 4.4% | 8.4% | 4.5% | 3.4% | 3.4% | 3.8% | 20 | 20 | 100% |
| 119407 | Diesel, semidiesel & dual-fuel engines (except automotive) | 2.1% | - | - | - | 1.6% | 1.5% | 15 | 10 | 67% |
| 119413 | Parts & accessories for internal combustion engines, ex. aircraft & gasoline automotive engines | 1.5% | 1.9% | 1.9% | 1.3% | 1.7% | 1.9% | 20 | 18 | 90% |
| 1197 | Turbines & turbine generator sets | 3.6% | 2.8% | - | -0.4% | 0.4% | 1.9% | 19 | 14 | 74% |
| 11970103 | Steam, gas & other turbines & turbine generators | 4.1% | - | 0.0% | 0.3% | - | - | 6 | 5 | 83% |
| 12 | Furniture & household durables | 2.0% | 3.9% | 2.5% | 1.6% | 1.5% | 1.5% | 20 | 19 | 95% |
| 121 | Household furniture | 2.3% | 2.6% | 2.6% | 2.0% | 1.8% | 1.9% | 20 | 19 | 95% |
| 1211 | Metal household furniture | 18.2% | -2.5% | 5.4% | 4.7% | 2.8% | 2.1% | 20 | 14 | 70% |
| 1212 | Wood household furniture | 1.8% | 0.1% | 1.2% | 1.3% | 1.8% | 1.9% | 20 | 20 | 100% |
| 1215 | Metal porch, lawn, outdoor & casual furniture | 3.4% | 4.2% | 2.4% | 2.7% | 3.3% | 3.3% | 20 | 16 | 80% |
| 122 | Commercial furniture | 2.5% | 5.9% | 3.2% | 2.2% | 1.9% | 2.1% | 20 | 18 | 90% |
| 1221 | Wood office furniture & store fixtures | 2.7% | 2.7% | 2.5% | 1.6% | 1.7% | 1.7% | 20 | 20 | 100% |
| 1222 | Nonwood furniture & store fixtures | 1.6% | 10.2% | 4.1% | 2.5% | 1.9% | 2.2% | 20 | 17 | 85% |
| 1223 | Public building furniture | 4.1% | 4.8% | 3.4% | 2.6% | 2.3% | 2.4% | 20 | 18 | 90% |
| 1224 | Commercial furniture & fixtures, n.e.c. | 5.3% | -1.3% | 1.9% | 2.4% | 2.1% | 2.1% | 20 | 18 | 90% |
| 1245 | Portable residential lighting fixtures, including parts & accessories | 8.2% | 2.6% | 4.0% | 2.6% | 2.6% | 2.1% | 20 | 15 | 75% |
| 126101 | Vitreous china, porcelain & earthenware table & kitchenware & other pottery products | 1.7% | 4.8% | 2.6% | 2.0% | 2.3% | 1.9% | 20 | 19 | 95% |
| 1266 | Lawn/garden equipment | 1.6% | 2.7% | 1.5% | 1.0% | 0.6% | 0.7% | 20 | 14 | 70% |
| 1268 | Metal kitchen utensil, pots & pans | 2.8% | 4.5% | 3.0% | 2.2% | 1.7% | 2.1% | 20 | 17 | 85% |
| 13 | Nonmetallic mineral products | 1.5% | 4.1% | 2.6% | 2.3% | 2.4% | 3.0% | 20 | 19 | 95% |
| 132 | Concrete ingredients & related products | 3.3% | 3.6% | 3.5% | 3.9% | 2.9% | 3.6% | 20 | 19 | 95% |
| 1321 | Construction sand, gravel & crushed stone | 3.8% | 4.0% | 3.6% | 3.8% | 3.1% | 4.1% | 20 | 20 | 100% |
| 133 | Concrete products | 2.7% | 3.5% | 3.0% | 3.1% | 2.6% | 3.2% | 20 | 17 | 85% |
| 1331 | Concrete block & brick | 3.1% | 3.5% | 3.1% | 2.7% | 2.0% | 2.8% | 20 | 18 | 90% |
| 133141 | Concrete pavers | 2.3% | 3.2% | 3.2% | 2.5% | 2.0% | 2.5% | 20 | 17 | 85% |
| 1332 | Concrete pipe | 5.6% | -1.4% | 2.3% | 2.0% | 1.8% | 3.0% | 20 | 16 | 80% |
| 1333 | Ready-mix concrete | 2.4% | 3.0% | 2.8% | 3.3% | 2.6% | 3.4% | 20 | 17 | 85% |
| 1334 | Precast concrete products | 2.6% | 6.4% | 4.0% | 2.8% | 2.9% | 3.1% | 20 | 19 | 95% |
| 134201 | Building or common brick | 1.9% | 1.1% | 1.5% | 1.4% | 0.3% | 1.7% | 20 | 16 | 80% |
| 135 | Refractories | 5.3% | 6.8% | 3.8% | 2.6% | 2.3% | 3.5% | 20 | 18 | 90% |
| 138 | Glass containers | 2.7% | 2.3% | 1.8% | 1.6% | 1.6% | 2.6% | 20 | 20 | 100% |
| 1395 | Cut stone & stone products | 2.8% | 6.4% | 2.2% | 2.3% | 1.7% | 1.2% | 20 | 15 | 75% |
| 13990209 | Ground or treated minerals & earths | 2.5% | 0.8% | 1.3% | 1.5% | 2.8% | 3.6% | 20 | 20 | 100% |
| 1413 | Truck & bus bodies | 3.9% | 3.8% | 2.9% | 2.3% | 1.9% | 2.5% | 20 | 19 | 95% |
| 1414 | Truck trailers | 2.9% | 8.5% | 4.2% | 2.7% | 2.4% | 2.5% | 20 | 17 | 85% |
| 1416 | Travel trailers & campers | 2.6% | 3.5% | 3.5% | 2.8% | 2.5% | 2.5% | 20 | 19 | 95% |
| 141602 | Camping trailers, campers, pick-up covers & parts | 3.5% | 4.9% | 5.7% | 4.9% | 3.7% | 3.5% | 20 | 20 | 100% |
| 141602014 | Truck campers, caps, box covers & folddown camping trailers | 3.9% | 3.1% | 3.2% | 3.2% | - | - | 5 | 5 | 100% |
| 142102 | Civilian aircraft | 2.2% | 3.0% | 2.5% | 1.8% | 2.1% | 3.2% | 20 | 19 | 95% |
| 14250103 | Aircraft parts & auxiliary equipment | 1.9% | 0.7% | 0.9% | 0.9% | - | - | 7 | 7 | 100% |
| 143 | Ships & boats | 3.2% | 0.8% | 1.9% | 1.5% | 1.5% | 2.5% | 20 | 20 | 100% |
| 1432 | Boats | 4.3% | 3.0% | 3.5% | 3.0% | 2.5% | 2.7% | 20 | 20 | 100% |
| 151 | Toys, sporting goods, small arms, etc. | 4.6% | 0.4% | 1.6% | 1.3% | 1.2% | 1.2% | 20 | 15 | 75% |
| 15120185 | Playground equipment | 4.6% | 7.2% | 4.5% | - | - | 4.6% | 14 | 12 | 86% |
| 152 | Tobacco products, incl. stemmed & redried | 6.2% | 5.7% | 5.7% | 5.4% | 5.3% | 4.4% | 20 | 18 | 90% |
| 155 | Mobile homes | 8.7% | 1.6% | 6.0% | 4.1% | 3.8% | 3.6% | 20 | 20 | 100% |
| 155303 | Manufactured mobile homes & nonresidential mobile buildings | 8.7% | 1.6% | 6.0% | 4.1% | 3.8% | 3.6% | 20 | 20 | 100% |
| 1563 | Medical & surgical appliances & supplies | 1.7% | 1.4% | 1.2% | 0.8% | 0.7% | 1.2% | 20 | 18 | 90% |
| 1565 | Dental equipment & supplies | 12.0% | 1.3% | 6.5% | 4.9% | 5.1% | 4.2% | 20 | 20 | 100% |
| 1591 | Burial caskets | 5.9% | 3.2% | 3.9% | 3.9% | 3.7% | 4.4% | 20 | 20 | 100% |
| 1594 | Jewelry & jewelry products | 2.8% | 0.5% | 1.1% | 1.6% | 2.4% | 2.7% | 20 | 14 | 70% |
| 159A0402 | Non-electric signs & displays | 3.1% | 2.9% | 3.9% | 2.6% | 2.1% | 2.1% | 20 | 18 | 90% |
Note: “-” dash indicates that an index was not published by the BLS for that period for one of the following reasons: 1) Insufficient number of price surveys received 2) Category did not exist during the period where a dash is shown
1 year inflation rates shown above use PPI for the 12 months ended December. For example, 1Y ended 2019 inflation rate is calculated as follows: Dec. ’19 ÷ Dec. ’18 PPI = 1Y inflation rate ended Dec. 2019.
Historical average annual inflation rates calculated using compound inflation formula. For example, 3Y average annual inflation rates calculated as follows: (((Dec. ’19 ÷ Dec. ’16 PPI)^(1/3))-1) = 3Y average annual inflation rate ended Dec. 2019.
Quick Analysis LIFO Tax Savings Formula
Use the following formulas to calculate the estimated LIFO tax savings that your client or company could achieve from using the LIFO method:
- Current year taxable income reduction = estimated y/e inventory balance * estimated c/y inflation
- Current year income tax reduction = current year taxable income reduction * tax rate
Example: To illustrate the use of the Quick Analysis LIFO Tax Savings Formula, assume the following:
Estimated year end inventory balance: $15,000,000
Estimated current year inflation: 2%
Tax rate: 30%
Current year taxable income reduction: $15,000,000 * 2% = $300,000
Current year income tax reduction: $300,000 * 30% = $90,000
A long-term LIFO benefit analysis could be achieved by using the same formula shown above and multiplying the results by the desired number of years that you’re wishing to project (i.e. 3/5/10/20 year).
Why we Use External Price Indexes to Identify the Top LIFO Candidates
Although there are many reasons why we use the government-published BLS PPI to identify the top LIFO candidates, the primary reasons are as follows:
- Contains over 3,000 unique commodities that covers nearly all industries
- Systematic procedures used to collect & calculate price indexes
- Published on a monthly basis, meaning monthly rates can be easily tracked & annual inflation rates can be computed for all fiscal year end months
- Consumer Price Index & Producer Price Index inflation can be used to make actual LIFO calculations (called IPIC LIFO; see our IPIC LIFO Overview & Resources page)
- External price indexes are often found to provide higher inflation rates than internally calculated price changes
Find Out How Much LIFO Will Benefit Your Company with a Complimentary LIFO Election Benefit Analysis !
LIFO Election Benefit AnalysisHow LIFO Works
Maintain the Benefits Without any of the Hassle!
Outsource your LIFO calculation so you can enjoy the benefits and avoid all the hassle! LIFO-PRO’s turnkey outsourcing solutions provides you with the ability to maximize your LIFO benefits while minimizing the time & effort required to do so. You send us your inventory documentation & we take care of the rest. The finished product is a complete set of LIFO-PRO reports that include the exact amounts required for financial reporting & tax returns LIFO entries.
Turnkey Outsourcing Solutions