2021 has brought unprecedented inflation to many industries, with lumber & steel commodities seeing the most profound increases out of all industries. The focus of this blog is to highlight the potential tax savings that companies in these industries could achieve by electing LIFO this coming year end.
Quick LIFO 101
- The LIFO method can be equated to working in a manner that’s similar to how nominal GDP is adjusted for inflation to arrive at real GDP
- Without GDP being adjusted for inflation, growth includes an artificial component that was created from factors other than true increases in output/consumption/spending (when there’s inflation)
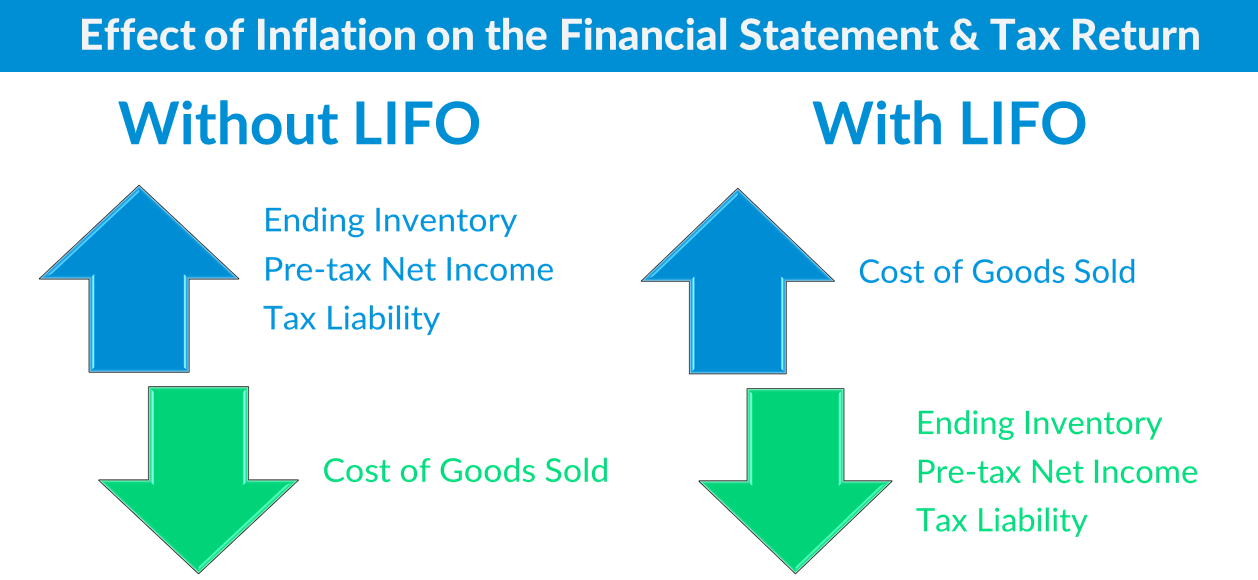
- Since inventory is a balance sheet item, but also directs the calculation of the cost of goods sold (an income statement item), LIFO transfers the inflationary component of ending inventory from the balance sheet to the income statement
- The impact of transferring inflationary costs from the balance sheet to the income statement is that it reduces ending inventory, increases costs of goods sold, decreases net income & a company’s overall tax liability
- Without inventory & cost of goods sold being adjusted for inflation, net income includes an artificial component that was created from factors other than true increases in revenue/sales (when there’s inflation)
Historical Inflation Data
This case study uses the Bureau of Labor Statistics Producer Price Index category to analyze & quantify the potential tax savings for companies in the lumber or steel industry. Accordingly, the annual inflation & historical annual averages for the lumber & steel industries are shown below:
| PPI Code | BLS PPI Category Description | YTD June '21 | 1Y June '21 | 3Y June '21 | 5Y June '21 | 10Y June '21 | 20Y June '21 |
|---|---|---|---|---|---|---|---|
| 08 | LUMBER AND WOOD PRODUCTS | 31.4% | 48.6% | 12.4% | 10.0% | 6.4% | 3.7% |
| 081 | Lumber | 53.8% | 98.2% | 20.4% | 17.1% | 10.4% | 4.9% |
| 082 | Millwork | 15.7% | 23.0% | 7.9% | 6.4% | 4.6% | 3.1% |
| 083 | Plywood | 78.7% | 129.0% | 23.4% | 18.6% | 10.1% | 5.7% |
| 084 | Other wood products | 17.1% | 20.5% | 7.6% | 6.0% | 3.8% | 2.4% |
| 085 | Logs, bolts, timber, pulpwood, woodchips and other roundwood products | 6.3% | 11.1% | 1.8% | 1.9% | 1.5% | 1.8% |
| 086 | Prefabricated wood buildings & components | 21.8% | 28.4% | 9.7% | 7.6% | 4.9% | 3.6% |
| 087 | Treated wood and contract wood preserving | 16.9% | 23.8% | 6.7% | 6.5% | 5.6% | 3.2% |
| 101 | Iron and steel | 55.6% | 74.0% | 13.2% | 12.9% | 3.3% | 6.0% |
| 1017 | Steel mill products | 78.1% | 88.1% | 16.7% | 15.1% | 4.5% | 6.2% |
| 101703 | Hot rolled steel sheet and strip, including tin mill products | 131.0% | 162.7% | 23.6% | 21.5% | 5.6% | 5.1% |
| 101704 | Hot rolled steel bars, plates, and structural shapes | 33.6% | 36.1% | 6.0% | 8.8% | 1.2% | 5.0% |
| 101706 | Steel pipe and tube | 30.7% | 38.2% | 8.1% | 10.8% | 2.6% | 6.3% |
| 101707 | Cold rolled steel sheet and strip | 136.6% | 145.5% | 27.5% | 21.3% | 7.4% | 8.0% |
| 101708 | Cold finished steel bars and bar shapes | 21.6% | 29.6% | 9.1% | 8.0% | 4.1% | 5.1% |
LIFO Calculation Example
- Current year inventory balance at cost (FIFO): $15M
- Prior year inventory balance at cost: $10M
- Current year inflation rate: 20%
- Current year LIFO expense formula* = prior year inventory balance at cost * current year inflation rate; $10M * 20% = $2M
Note: above example is extremely simplified & assumes that there was no “layer erosion effect LIFO income” created from a decrease in the current vs. prior year’s inventory balance at cost. Generally speaking, the amount of LIFO expense can be calculated by multiplying the prior year
LIFO Terms & Must Knows
- LIFO reserve: Difference between inventory valued at cost & inventory valued at LIFO (FIFO value – LIFO value = LIFO reserve). Also represents the cumulative taxable income reduction from LIFO.
- LIFO expense (income): Change in the current vs. prior year’s LIFO reserve. Represents the current year taxable income reduction from LIFO (can increase taxable income if there is 1. deflation 2. significant inventory liquidations)
- Cumulative after-tax cash savings from LIFO = LIFO reserve * tax rate
- Current year after-tax cash savings from LIFO = LIFO expense * tax rate