The Bureau of Labor Statistics (BLS) released June 2022 Consumer Price Indexes (CPI) today. Highlights are as follows (all indexes are on a seasonally unadjusted basis):
- All items increased 1.4% over the last month and rose 9.1% over the last twelve months
- Commodities, less food + energy commodities, increased 0.8% from May 2022 and rose 7.2% since June 2021
- Energy commodities increased 9.3% in the last month and rose 60.6% in the last twelve months
- Food at home rose 1.0% since May 2022 and increased 12.2% since June 2021
- Cereals + bakery products rose 2.0% in the last month and increased 13.8% in the last twelve months
- Meats, poultry, fish + eggs rose 0.4% from May 2022 and increased 11.7% since June 2021
- Dairy + related products rose 1.4% in the last month and increased 13.5% in the last twelve months
- Beverage materials, including coffee + tea, increased 1.0% from May 2022 and rose 12.4% since June 2021
- Household paper products increased 2.2% in the last month and rose 9.4% in the last twelve months
- Apparel decreased 0.3% from May 2022 and rose 5.2% since June 2021
- New vehicles rose 0.7% in the last month and increased 11.4% in the lats twelve months
- Used cars + trucks increased 2.2% from May 2022 and rose 7.1% since June 2021
- Motor vehicle parts + equipment rose 0.4% in the last month and increased 14.9% in the last twelve months
BLS CPI Historical Annual Inflation Rate Averages Through June 2022
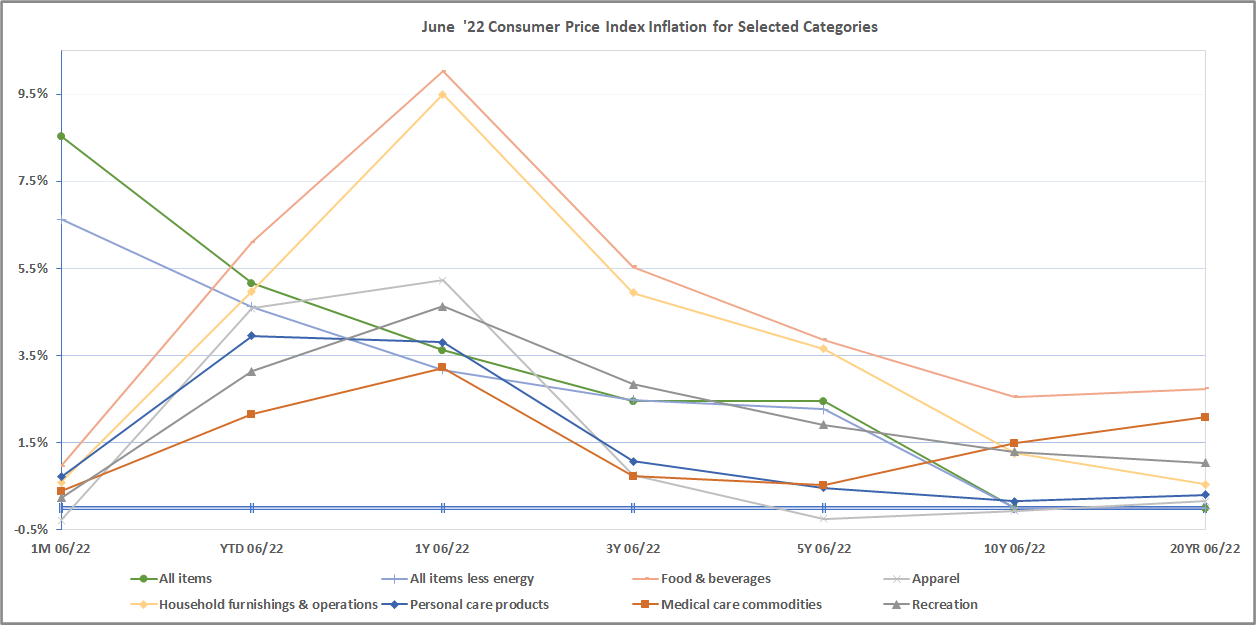
BLS CPI Historical Annual Inflation Rate Averages Through June 2022 Table For Selected Categories
| BLS CPI Code | BLS CPI Category Description | 1M 06/22 | YTD 06/22 | 1Y 06/22 | 3Y 06/22 | 5Y 06/22 | 10Y 06/22 | 20YR 06/22 |
|---|---|---|---|---|---|---|---|---|
| SAF | FOOD & BEVERAGES | 1.0% | 6.1% | 10.0% | 5.5% | 3.9% | 2.6% | 2.7% |
| SAF11 | Food at home | 1.0% | 8.0% | 12.2% | 6.2% | 3.9% | 2.1% | 2.5% |
| SAF114 | Nonalcoholic beverages & beverage materials | 0.9% | 7.6% | 11.9% | 5.7% | 3.7% | 1.7% | 1.9% |
| SEFN | Juices & nonalcoholic drinks | 0.8% | 6.3% | 11.6% | 6.0% | 4.1% | 2.1% | 2.0% |
| SEFN01 | Carbonated drinks | -0.1% | 5.3% | 11.0% | 6.3% | 4.4% | 2.4% | 2.5% |
| SEFN03 | Nonfrozen noncarbonated juices & drinks | 1.4% | 7.0% | 12.1% | 5.8% | 3.8% | 1.8% | 1.4% |
| SEFP | Beverage materials including coffee & tea | 1.0% | 10.7% | 12.4% | 4.9% | 2.9% | 0.8% | 1.8% |
| SEFP01 | Coffee | 0.9% | 12.1% | 15.8% | 5.5% | 2.9% | 0.4% | 2.4% |
| SEFP02 | Other beverage materials including tea | 1.0% | 8.2% | 6.4% | 3.8% | 2.7% | 1.4% | 1.4% |
| SAF115 | Other food at home | 1.9% | 9.2% | 14.4% | 5.9% | 3.7% | 1.9% | 2.3% |
| SEFT06 | Other miscellaneous foods | 2.4% | 8.4% | 14.5% | 6.2% | 3.8% | 1.8% | 1.9% |
| SEFW | Alcoholic beverages at home | 0.5% | 3.0% | 2.9% | 2.1% | 1.8% | 1.2% | 1.4% |
| SEFW01 | Beer, ale & other malt beverages at home | 0.8% | 4.2% | 4.3% | 3.5% | 2.6% | 2.0% | 2.2% |
| SEFW02 | Distilled spirits at home | 0.1% | 0.5% | 1.3% | 1.5% | 1.2% | 0.8% | 0.9% |
| SEFW03 | Wine at home | 0.5% | 3.0% | 2.3% | 1.1% | 1.1% | 0.5% | 0.8% |
| SEHE | FUEL OIL & OTHER FUELS | -0.9% | 44.4% | 70.4% | 21.8% | 14.2% | 3.9% | 7.7% |
| SAH3 | HOUSEHOLD FURNISHINGS & OPERATIONS | 0.6% | 5.0% | 9.5% | 4.9% | 3.7% | 1.3% | 0.5% |
| SAA | APPAREL | -0.3% | 4.6% | 5.2% | 0.8% | -0.2% | -0.1% | 0.2% |
| SAM1 | MEDICAL CARE COMMODITIES | 0.4% | 2.2% | 3.2% | 0.7% | 0.5% | 1.5% | 2.1% |
| SEMF | Medicinal drugs | 0.4% | 2.1% | 3.1% | 0.8% | 0.5% | 1.6% | |
| SEMF01 | Prescription drugs | 0.1% | 1.4% | 2.5% | 0.6% | 0.4% | 1.9% | 8.4% |
| SEMF02 | Nonprescription drugs | 1.2% | 3.8% | 4.7% | 1.0% | 0.8% | 0.0% | |
| SEMG | Medical equipment and supplies | 0.6% | 3.5% | 5.9% | -0.9% | 0.3% | -0.1% | |
| SAR | RECREATION | 0.2% | 3.1% | 4.6% | 2.8% | 1.9% | 1.3% | 1.0% |
| SEEA | EDUCATIONAL BOOKS & SUPPLIES | 0.0% | 4.9% | 3.7% | 1.5% | 1.0% | 2.6% | 4.2% |
| SEGA | TOBACCO & SMOKING PRODUCTS | 0.6% | 2.9% | 7.9% | 6.7% | 5.5% | 4.7% | 5.4% |
| SEGB | PERSONAL CARE PRODUCTS | 0.7% | 4.0% | 3.8% | 1.1% | 0.5% | 0.2% | 0.3% |
| SEGE | MISCELLANEOUS PERSONAL GOODS | -0.4% | 7.3% | 11.4% | 5.0% | 2.0% | -0.1% | -0.5% |
| SAG | OTHER GOODS AND SERVICES | 0.5% | 3.7% | 6.7% | 4.0% | 3.1% | 2.5% | 2.7% |
| SERE | Other recreational goods | -0.3% | 2.3% | 2.7% | -0.9% | -2.9% | -4.5% | -4.2% |
| SERG | Recreational reading materials | 3.1% | 6.5% | 7.4% | 4.6% | 3.7% | 2.3% | 2.0% |