The Bureau of Labor Statistics (BLS) released July 2020 Consumer Price Indexes (CPI) today. The All Commodities index saw a 0.5% increase over the last month & has increased 1.0% over the last 12 months on a seasonally unadjusted basis. Housekeeping supplies increased 1.8% from June – July 2020 & rose 5.2% between July ’19 – ’20. Food at home decreased 1.0% the last month and saw a 4.6% increase from July ’19 – July ’20. Meats, poultry, fish and eggs decreased 3.6% over the last month & rose 8.4% over the last 12 months. Fresh fruits and vegetables rose 0.4% between June and July 2020 & and increased by 1.7% between July ’19 – ’20. Alcoholic beverages at home was unchanged in the last month and rose 1.6% in the last twelve months. Nonalcoholic beverages and beverage materials decreased 0.6% from June 2020 and increased 5.0% between July 2019 – July 2020. Household furnishings and supplies increased by 0.2% in the last thirty days and saw an increase of 1.5% in the last twelve months. Apparel decreased 0.4% from June 2020 and decreased 6.5% from July 2019. Medical care commodities saw no change from June 2020 and increased 1.1% from July 2019. Recreation commodities rose by 0.5% in the last thirty days and decreased 1.3% in the last twelve months. Tobacco smoking products went up by 1.1% since June 2020 and saw an increase of 5.2% from July 2019. Household paper products rose by 3.7% in the last thirty days and saw an increase of 10.3% in the last twelve months. Sports vehicles including bicycles had an increase of 2.4% in the last month and an increase of 6.2% in the last year. Major appliances increased by 2.2% from June 2020 and had an increase of 5.2% from July 2019.
BLS PPI Historical Annual Inflation Rate Averages Table for Selected Commodities Through July 2020
| PPI Code | BLS PPI Category Description | 1 Month July '20 | YTD July '20 | 1 Year July '20 | 3 Year July '20 | 5 Year July '20 | 10 Year July '20 | 20 Year July '20 |
|---|---|---|---|---|---|---|---|---|
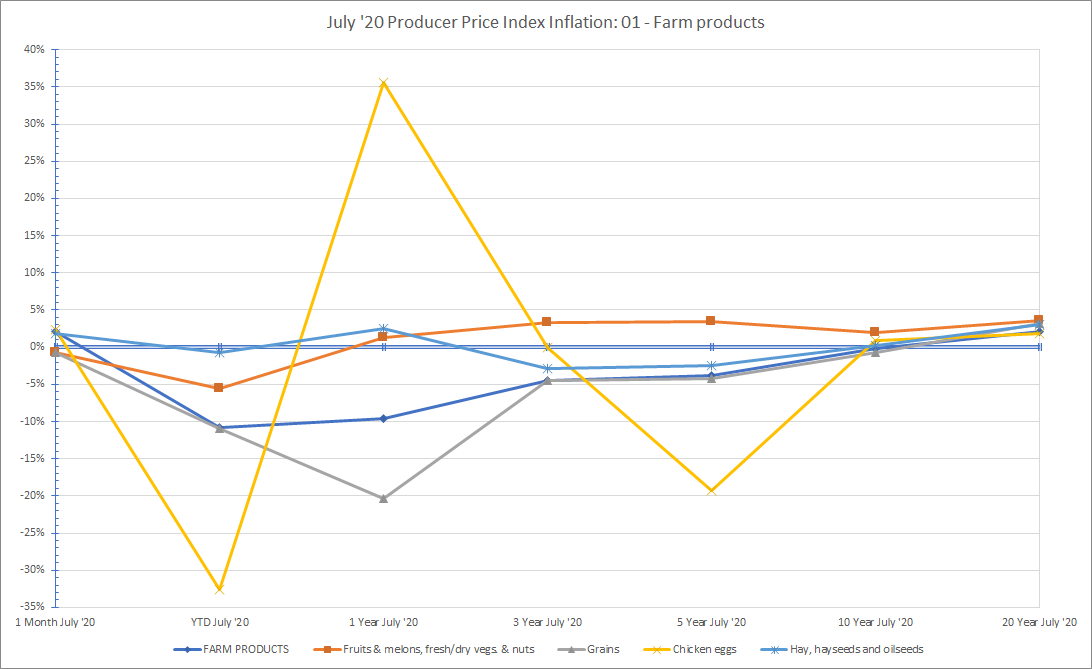
| 01 | FARM PRODUCTS | 2.1% | -10.8% | -9.5% | -4.5% | -3.9% | -0.2% | 2.1% |
| 011 | Fruits & melons, fresh/dry vegs. & nuts | -0.7% | -5.6% | 1.3% | 3.3% | 3.5% | 2.0% | 3.6% |
| 012 | Grains | -0.7% | -10.9% | -20.4% | -4.4% | -4.2% | -0.7% | 3.2% |
| 013 | Slaughter livestock | -6.4% | -14.6% | -15.9% | -9.1% | -8.1% | -1.2% | 1.3% |
| 014 | Slaughter poultry | -2.2% | -13.9% | -19.6% | -11.5% | -4.5% | -1.1% | 2.0% |
| 015 | Raw cotton | 4.4% | -4.2% | 2.1% | -4.1% | -2.8% | -1.2% | 0.5% |
| 016 | Raw milk | 45.0% | -14.4% | -3.7% | -0.9% | 0.0% | 1.2% | 1.4% |
| 017 | Chicken eggs | 2.4% | -32.6% | 35.6% | -0.1% | -19.3% | 1.0% | 1.9% |
| 018 | Hay, hayseeds and oilseeds | 1.8% | -0.7% | 2.4% | -2.9% | -2.5% | 0.2% | 3.1% |
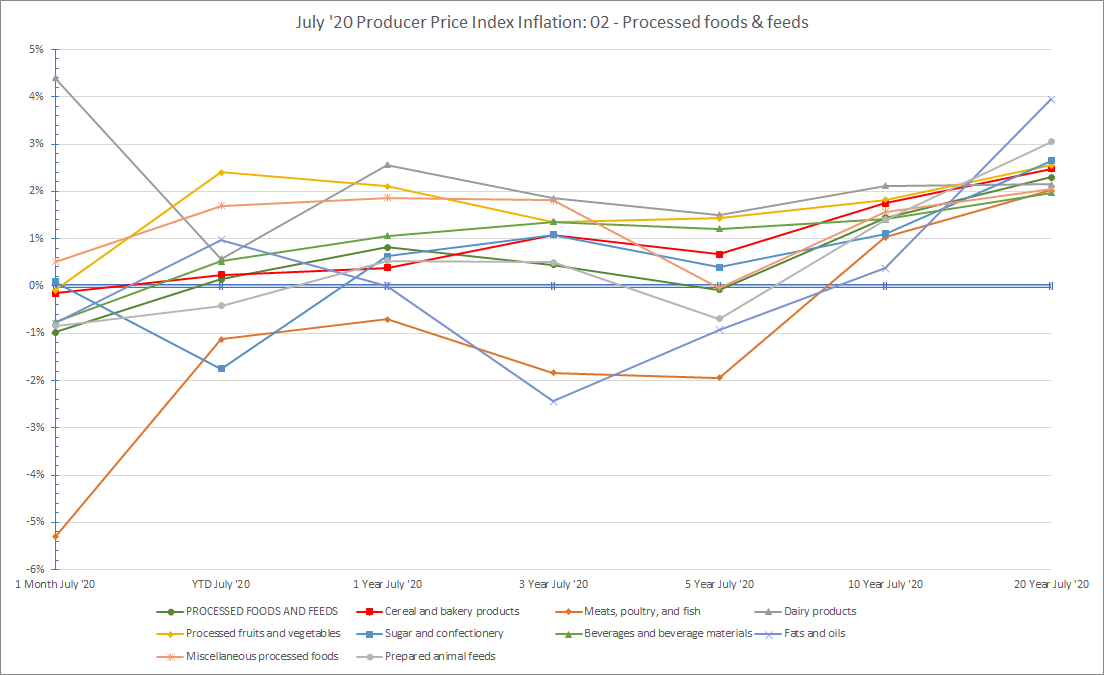
| 02 | PROCESSED FOODS AND FEEDS | -1.0% | 0.1% | 0.8% | 0.4% | -0.1% | 1.4% | 2.3% |
| 021 | Cereal and bakery products | -0.2% | 0.2% | 0.4% | 1.1% | 0.7% | 1.7% | 2.5% |
| 022 | Meats, poultry, and fish | -5.3% | -1.1% | -0.7% | -1.8% | -1.9% | 1.0% | 2.0% |
| 023 | Dairy products | 4.4% | 0.6% | 2.6% | 1.9% | 1.5% | 2.1% | 2.1% |
| 024 | Processed fruits and vegetables | -0.1% | 2.4% | 2.1% | 1.4% | 1.4% | 1.8% | 2.6% |
| 025 | Sugar and confectionery | 0.1% | -1.8% | 0.6% | 1.1% | 0.4% | 1.1% | 2.6% |
| 026 | Beverages and beverage materials | -0.8% | 0.5% | 1.1% | 1.4% | 1.2% | 1.4% | 2.0% |
| 027 | Fats and oils | -0.8% | 1.0% | 0.0% | -2.4% | -0.9% | 0.4% | 3.9% |
| 028 | Miscellaneous processed foods | 0.5% | 1.7% | 1.9% | 1.8% | 0.0% | 1.6% | 2.1% |
| 029 | Prepared animal feeds | -0.8% | -0.4% | 0.5% | 0.5% | -0.7% | 1.4% | 3.0% |
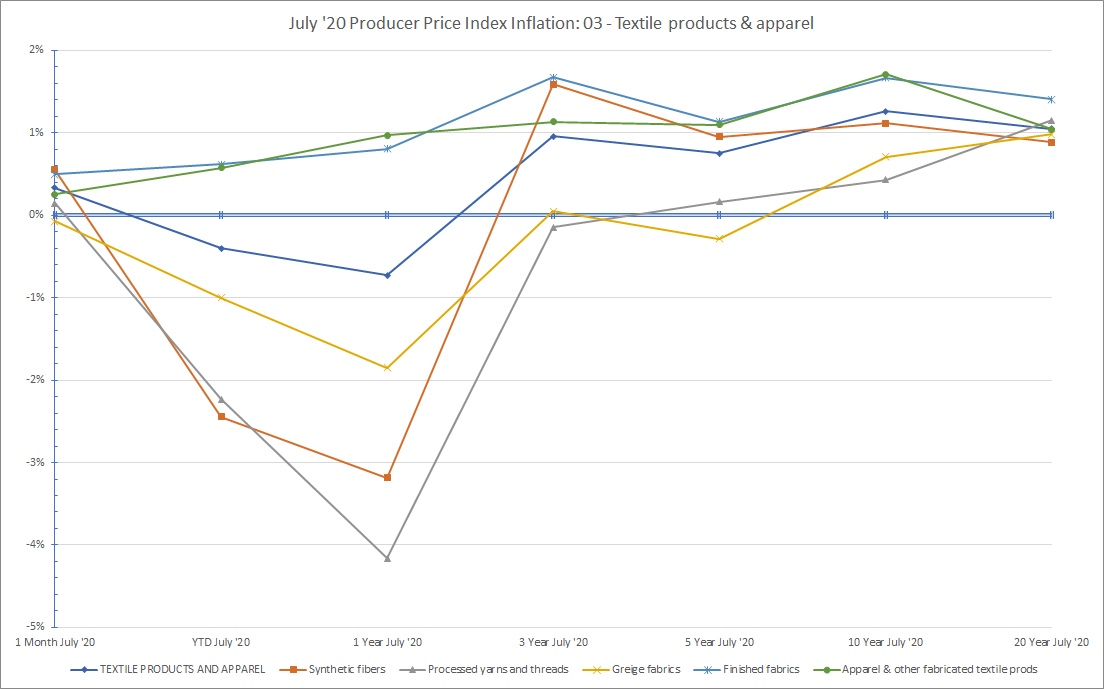
| 03 | TEXTILE PRODUCTS AND APPAREL | 0.3% | -0.4% | -0.7% | 1.0% | 0.8% | 1.3% | 1.0% |
| 031 | Synthetic fibers | 0.6% | -2.4% | -3.2% | 1.6% | 1.0% | 1.1% | 0.9% |
| 032 | Processed yarns and threads | 0.1% | -2.2% | -4.2% | -0.1% | 0.2% | 0.4% | 1.2% |
| 033 | Greige fabrics | -0.1% | -1.0% | -1.8% | 0.0% | -0.3% | 0.7% | 1.0% |
| 034 | Finished fabrics | 0.5% | 0.6% | 0.8% | 1.7% | 1.1% | 1.7% | 1.4% |
| 038 | Apparel & other fabricated textile prods | 0.3% | 0.6% | 1.0% | 1.1% | 1.1% | 1.7% | 1.0% |
| 039 | Miscellaneous textile products/services | 0.5% | -0.5% | -3.3% | -3.1% | -1.8% | -0.3% | 0.6% |
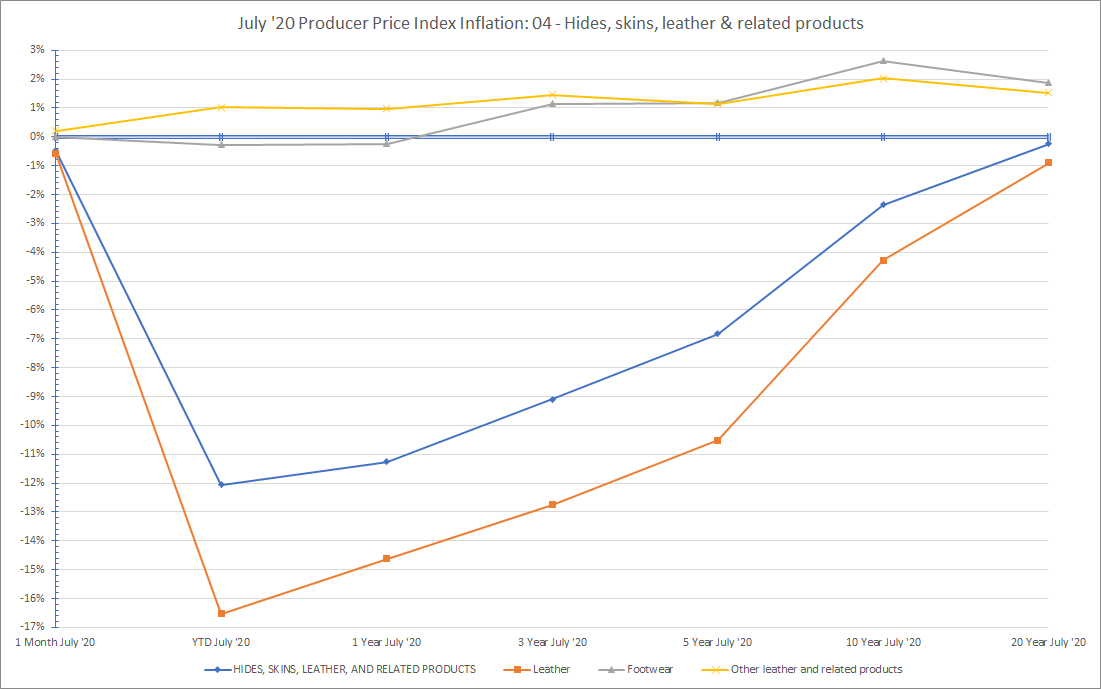
| 04 | HIDES, SKINS, LEATHER, AND RELATED PRODUCTS | -0.5% | -12.1% | -11.3% | -9.1% | -6.8% | -2.3% | -0.2% |
| 041 | Hides and skins, incl. cattle | -3.2% | -41.1% | -39.5% | -29.1% | -21.3% | -11.0% | -4.3% |
| 042 | Leather | -0.6% | -16.5% | -14.6% | -12.8% | -10.5% | -4.3% | -0.9% |
| 043 | Footwear | 0.0% | -0.3% | -0.2% | 1.1% | 1.2% | 2.6% | 1.9% |
| 044 | Other leather and related products | 0.2% | 1.0% | 1.0% | 1.5% | 1.2% | 2.0% | 1.5% |
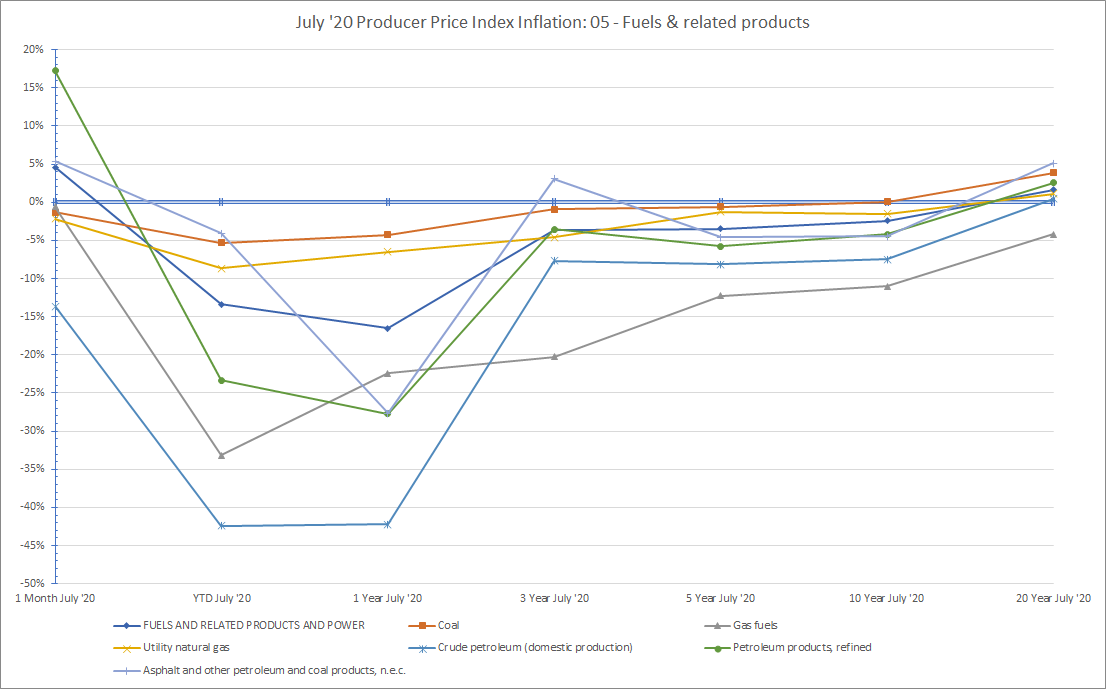
| 05 | FUELS AND RELATED PRODUCTS AND POWER | 4.6% | -13.4% | -16.6% | -3.6% | -3.5% | -2.4% | 1.6% |
| 051 | Coal | -1.3% | -5.3% | -4.3% | -0.9% | -0.6% | 0.0% | 3.9% |
| 053 | Gas fuels | -0.6% | -33.2% | -22.4% | -20.3% | -12.3% | -11.0% | -4.2% |
| 055 | Utility natural gas | -2.2% | -8.7% | -6.5% | -4.6% | -1.3% | -1.5% | 1.1% |
| 056 | Crude petroleum (domestic production) | -13.6% | -42.4% | -42.2% | -7.7% | -8.1% | -7.5% | 0.4% |
| 057 | Petroleum products, refined | 17.2% | -23.3% | -27.7% | -3.5% | -5.8% | -4.2% | 2.5% |
| 058 | Asphalt and other petroleum and coal products, n.e.c. | 5.4% | -4.1% | -27.7% | 3.1% | -4.6% | -4.4% | 5.1% |
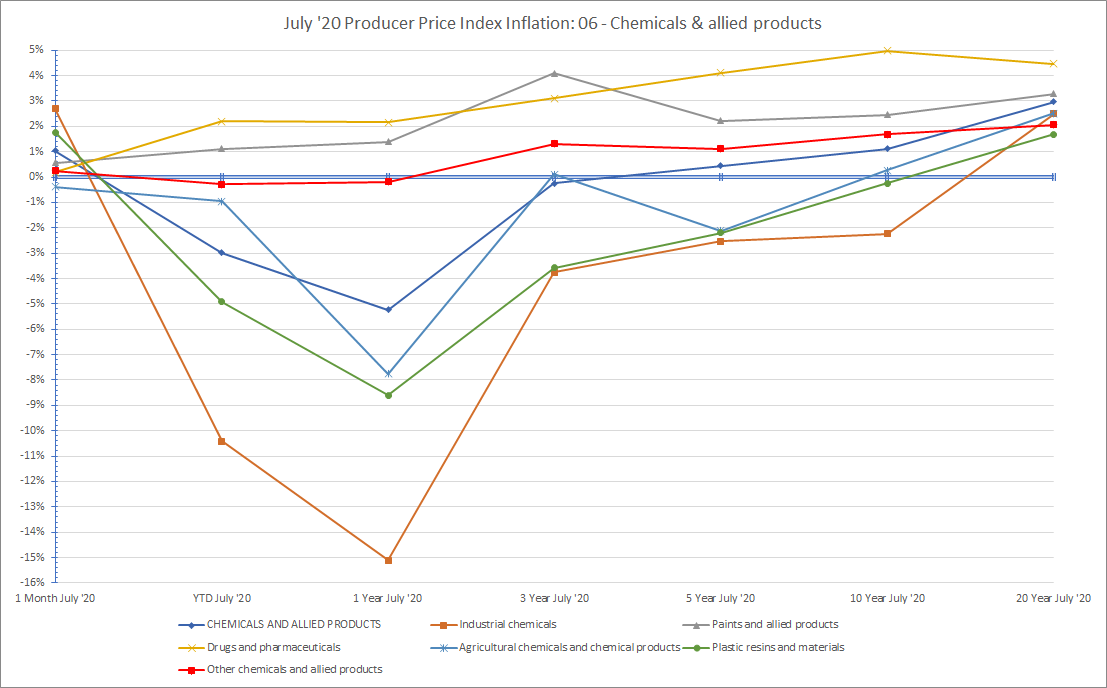
| 06 | CHEMICALS AND ALLIED PRODUCTS | 1.0% | -3.0% | -5.2% | -0.3% | 0.4% | 1.1% | 3.0% |
| 061 | Industrial chemicals | 2.7% | -10.4% | -15.1% | -3.7% | -2.5% | -2.2% | 2.5% |
| 062 | Paints and allied products | 0.6% | 1.1% | 1.4% | 4.1% | 2.2% | 2.4% | 3.3% |
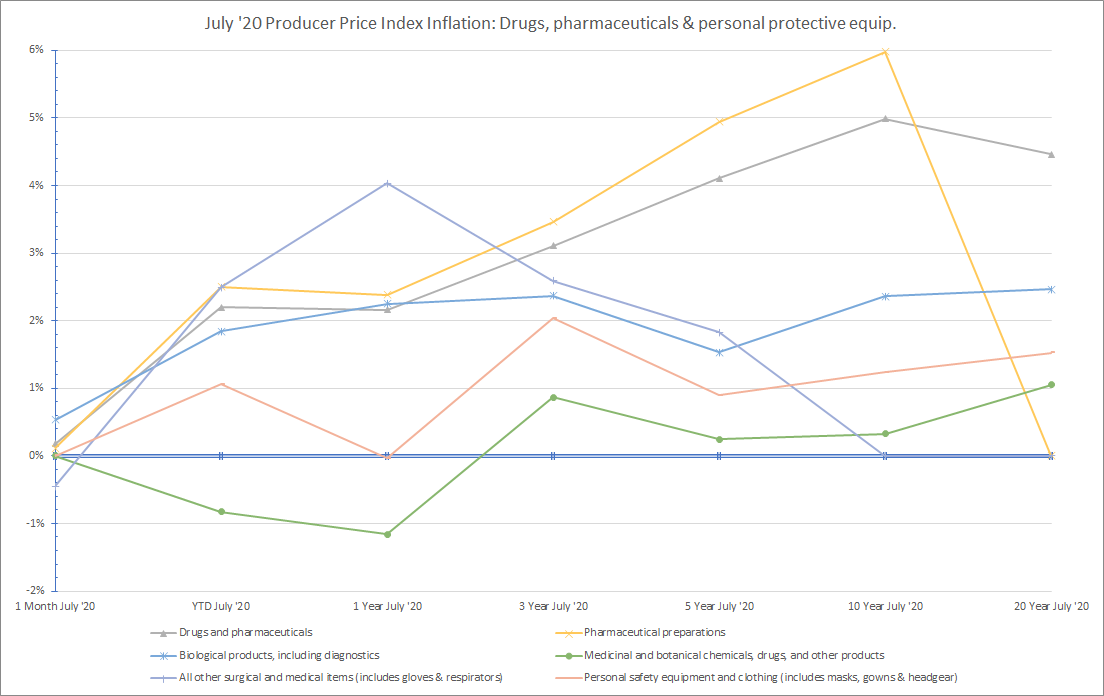
| 063 | Drugs and pharmaceuticals | 0.2% | 2.2% | 2.2% | 3.1% | 4.1% | 5.0% | 4.5% |
| 064 | Fats and oils, inedible | 1.4% | -2.6% | 0.9% | -5.7% | -2.0% | -1.9% | 5.5% |
| 065 | Agricultural chemicals and chemical products | -0.4% | -1.0% | -7.8% | 0.1% | -2.1% | 0.3% | 2.5% |
| 066 | Plastic resins and materials | 1.8% | -4.9% | -8.6% | -3.6% | -2.2% | -0.2% | 1.7% |
| 067 | Other chemicals and allied products | 0.2% | -0.3% | -0.2% | 1.3% | 1.1% | 1.7% | 2.1% |
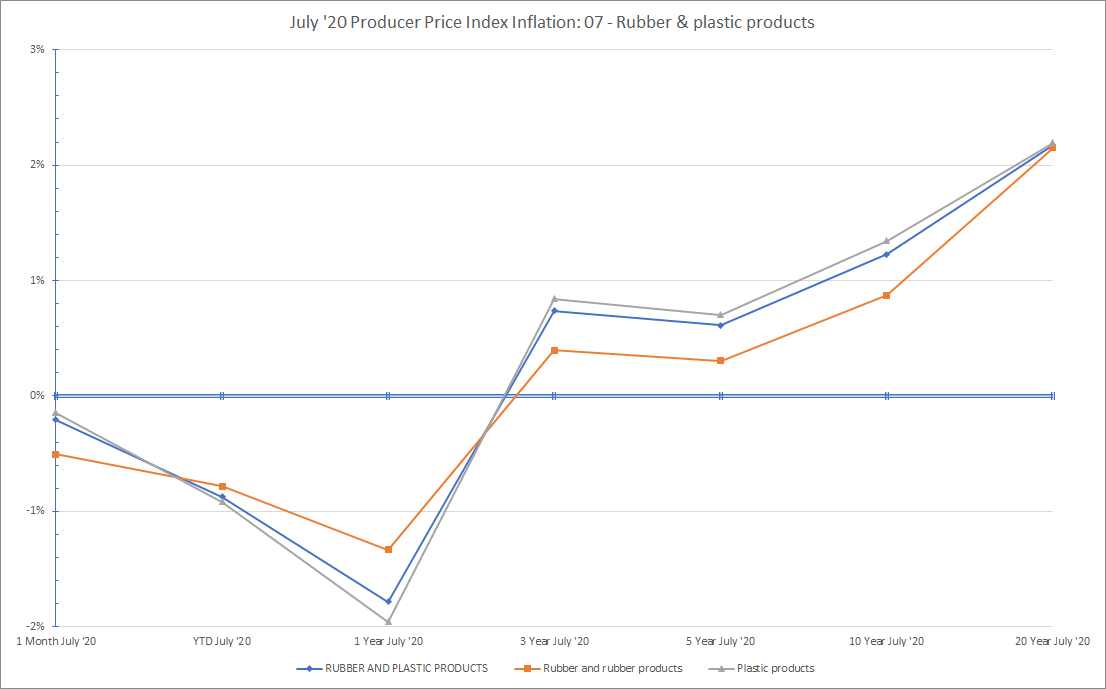
| 07 | RUBBER AND PLASTIC PRODUCTS | -0.2% | -0.9% | -1.8% | 0.7% | 0.6% | 1.2% | 2.2% |
| 071 | Rubber and rubber products | -0.5% | -0.8% | -1.3% | 0.4% | 0.3% | 0.9% | 2.1% |
| 072 | Plastic products | -0.1% | -0.9% | -2.0% | 0.8% | 0.7% | 1.3% | 2.2% |
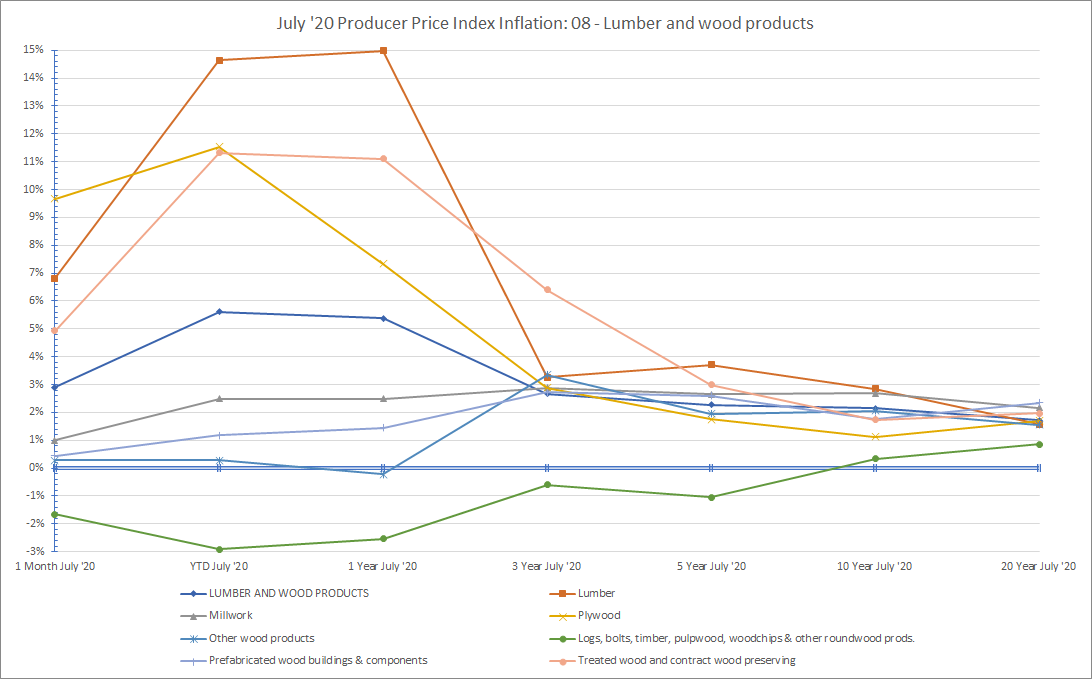
| 08 | LUMBER AND WOOD PRODUCTS | 2.9% | 5.6% | 5.4% | 2.7% | 2.3% | 2.1% | 1.7% |
| 081 | Lumber | 6.8% | 14.6% | 15.0% | 3.3% | 3.7% | 2.9% | 1.6% |
| 082 | Millwork | 1.0% | 2.5% | 2.5% | 2.9% | 2.6% | 2.7% | 2.2% |
| 083 | Plywood | 9.7% | 11.5% | 7.3% | 2.9% | 1.8% | 1.1% | 1.7% |
| 084 | Other wood products | 0.3% | 0.3% | -0.2% | 3.3% | 2.0% | 2.1% | 1.6% |
| 085 | Logs, bolts, timber, pulpwood, woodchips and other roundwood products | -1.7% | -2.9% | -2.5% | -0.6% | -1.1% | 0.3% | 0.9% |
| 086 | Prefabricated wood buildings & components | 0.4% | 1.2% | 1.4% | 2.7% | 2.6% | 1.8% | 2.4% |
| 087 | Treated wood and contract wood preserving | 4.9% | 11.3% | 11.1% | 6.4% | 3.0% | 1.7% | 2.0% |
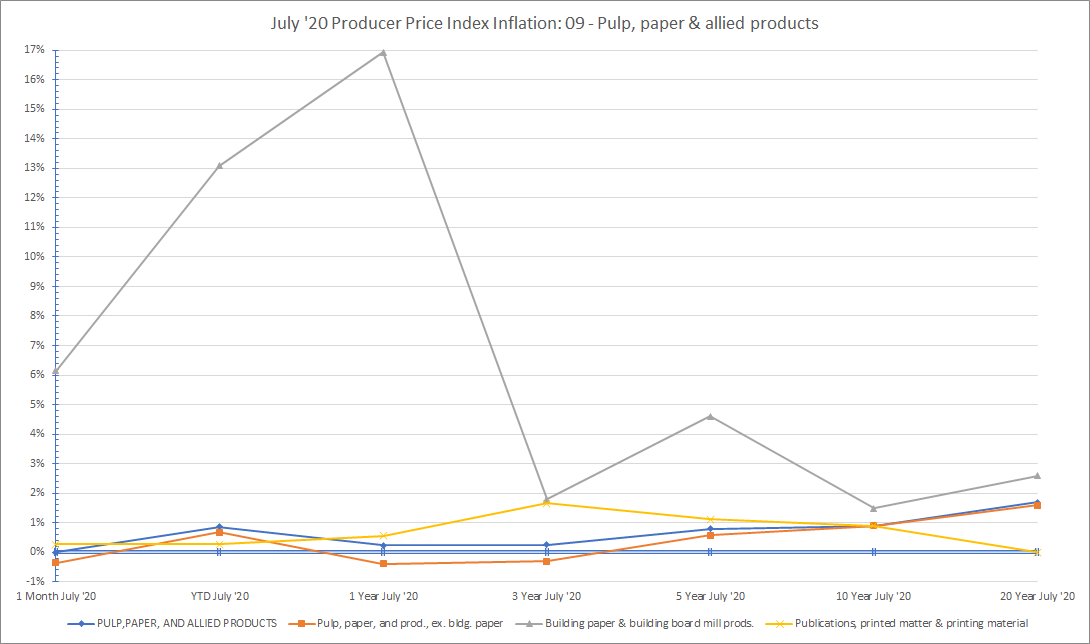
| 09 | PULP,PAPER, AND ALLIED PRODUCTS | 0.0% | 0.9% | 0.2% | 0.3% | 0.8% | 0.9% | 1.7% |
| 091 | Pulp, paper, and prod., ex. bldg. paper | -0.4% | 0.7% | -0.4% | -0.3% | 0.6% | 0.9% | 1.6% |
| 092 | Building paper & building board mill prods. | 6.1% | 13.1% | 16.9% | 1.8% | 4.6% | 1.5% | 2.6% |
| 094 | Publications, printed matter & printing material | 0.3% | 0.3% | 0.5% | 1.7% | 1.1% | 0.9% | |
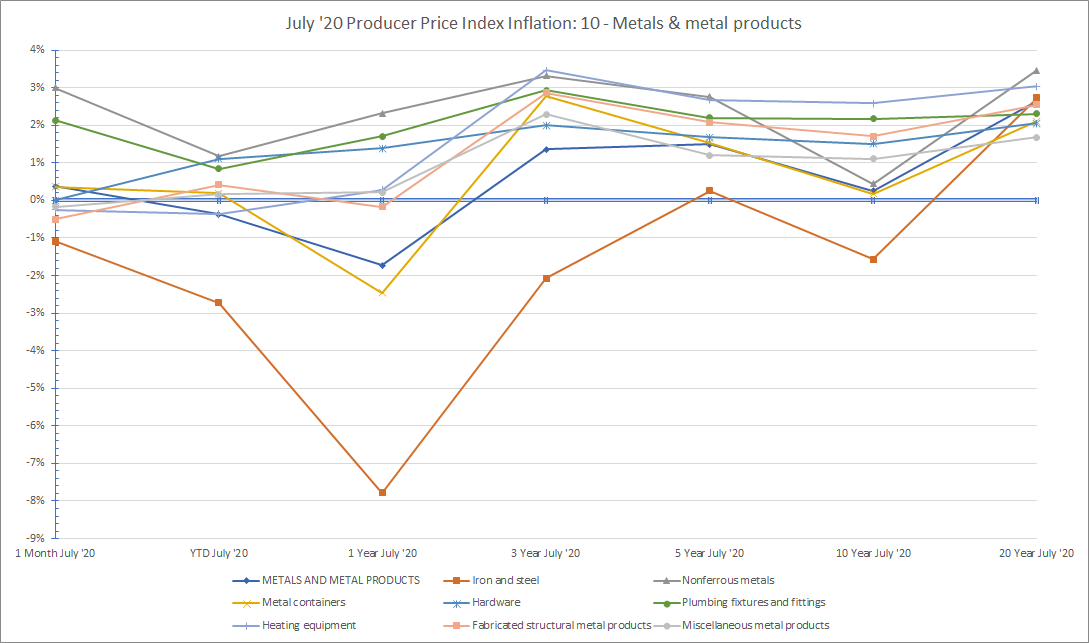
| 10 | METALS AND METAL PRODUCTS | 0.4% | -0.4% | -1.7% | 1.4% | 1.5% | 0.3% | 2.7% |
| 101 | Iron and steel | -1.1% | -2.7% | -7.8% | -2.1% | 0.3% | -1.6% | 2.7% |
| 102 | Nonferrous metals | 3.0% | 1.2% | 2.3% | 3.3% | 2.8% | 0.4% | 3.5% |
| 103 | Metal containers | 0.4% | 0.2% | -2.5% | 2.8% | 1.5% | 0.2% | 2.1% |
| 104 | Hardware | 0.0% | 1.1% | 1.4% | 2.0% | 1.7% | 1.5% | 2.1% |
| 105 | Plumbing fixtures and fittings | 2.1% | 0.8% | 1.7% | 2.9% | 2.2% | 2.2% | 2.3% |
| 106 | Heating equipment | -0.2% | -0.4% | 0.3% | 3.5% | 2.7% | 2.6% | 3.0% |
| 107 | Fabricated structural metal products | -0.5% | 0.4% | -0.2% | 2.9% | 2.1% | 1.7% | 2.5% |
| 108 | Miscellaneous metal products | -0.2% | 0.2% | 0.2% | 2.3% | 1.2% | 1.1% | 1.7% |
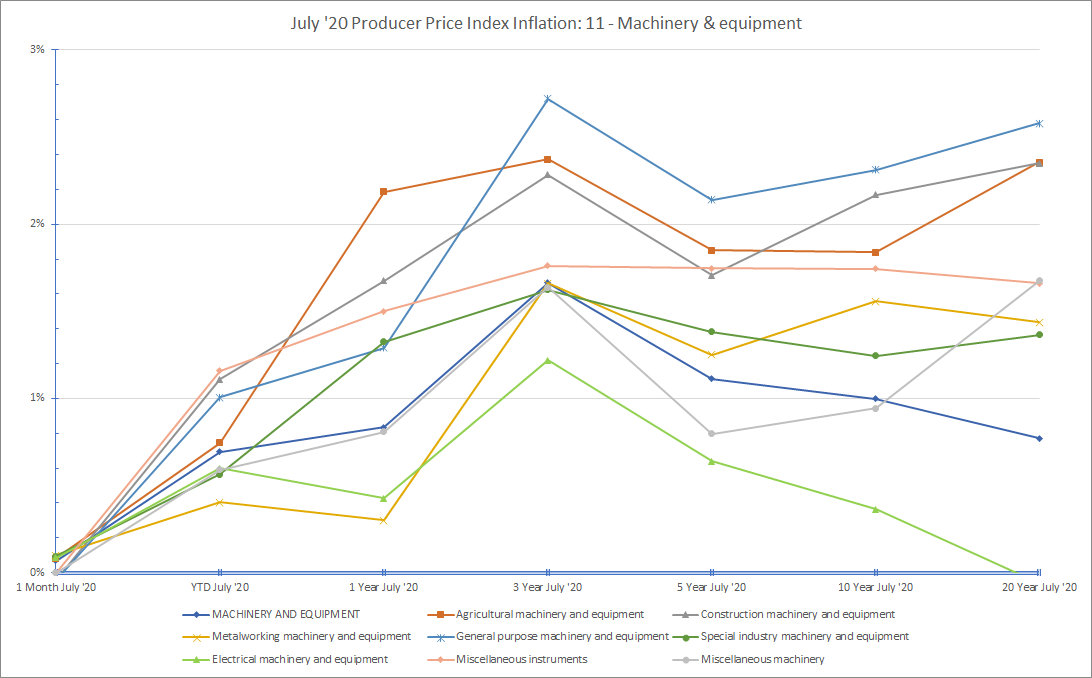
| 11 | MACHINERY AND EQUIPMENT | 0.1% | 0.7% | 0.8% | 1.7% | 1.1% | 1.0% | 0.8% |
| 111 | Agricultural machinery and equipment | 0.1% | 0.7% | 2.2% | 2.4% | 1.9% | 1.8% | 2.4% |
| 112 | Construction machinery and equipment | 0.0% | 1.1% | 1.7% | 2.3% | 1.7% | 2.2% | 2.4% |
| 113 | Metalworking machinery and equipment | 0.1% | 0.4% | 0.3% | 1.7% | 1.3% | 1.6% | 1.4% |
| 114 | General purpose machinery and equipment | 0.0% | 1.0% | 1.3% | 2.7% | 2.1% | 2.3% | 2.6% |
| 115 | Electronic computers and computer equipment | 0.8% | -1.5% | -1.2% | -2.3% | -2.4% | -3.3% | -5.9% |
| 116 | Special industry machinery and equipment | 0.1% | 0.6% | 1.3% | 1.6% | 1.4% | 1.2% | 1.4% |
| 117 | Electrical machinery and equipment | 0.1% | 0.6% | 0.4% | 1.2% | 0.6% | 0.4% | -0.1% |
| 118 | Miscellaneous instruments | 0.0% | 1.2% | 1.5% | 1.8% | 1.7% | 1.7% | 1.7% |
| 119 | Miscellaneous machinery | 0.0% | 0.6% | 0.8% | 1.6% | 0.8% | 0.9% | 1.7% |
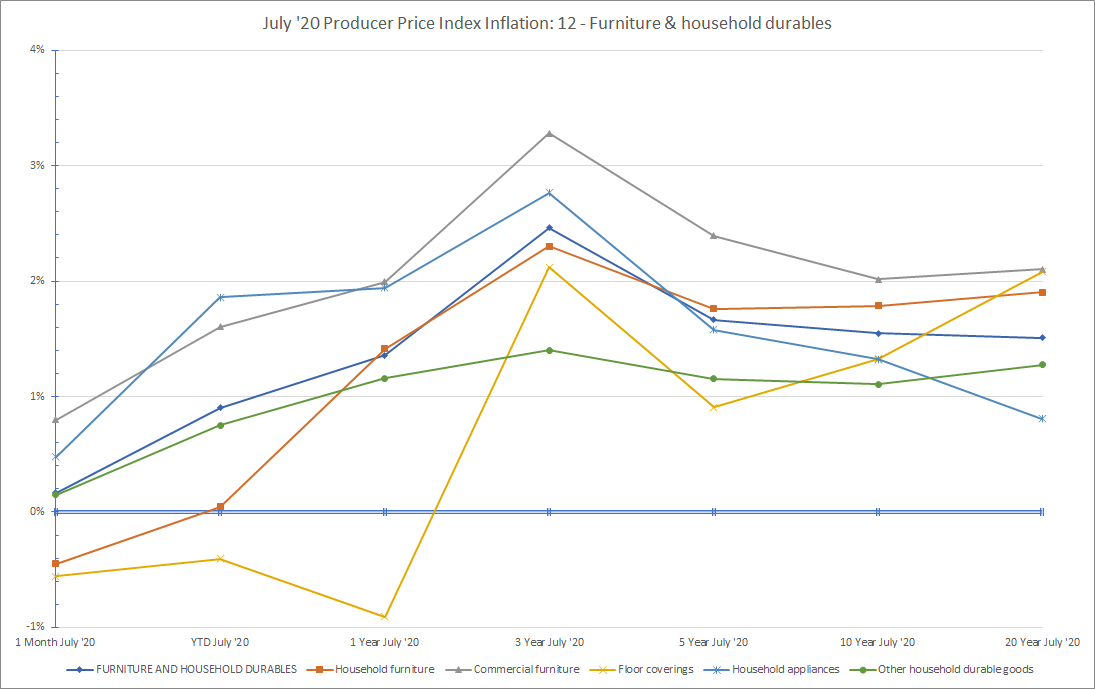
| 12 | FURNITURE AND HOUSEHOLD DURABLES | 0.2% | 0.9% | 1.4% | 2.5% | 1.7% | 1.5% | 1.5% |
| 121 | Household furniture | -0.4% | 0.0% | 1.4% | 2.3% | 1.8% | 1.8% | 1.9% |
| 122 | Commercial furniture | 0.8% | 1.6% | 2.0% | 3.3% | 2.4% | 2.0% | 2.1% |
| 123 | Floor coverings | -0.6% | -0.4% | -0.9% | 2.1% | 0.9% | 1.3% | 2.1% |
| 124 | Household appliances | 0.5% | 1.9% | 1.9% | 2.8% | 1.6% | 1.3% | 0.8% |
| 125 | Home electronic equipment | 0.6% | 1.0% | 2.5% | 0.9% | 0.7% | 0.0% | -1.5% |
| 126 | Other household durable goods | 0.1% | 0.8% | 1.2% | 1.4% | 1.2% | 1.1% | 1.3% |
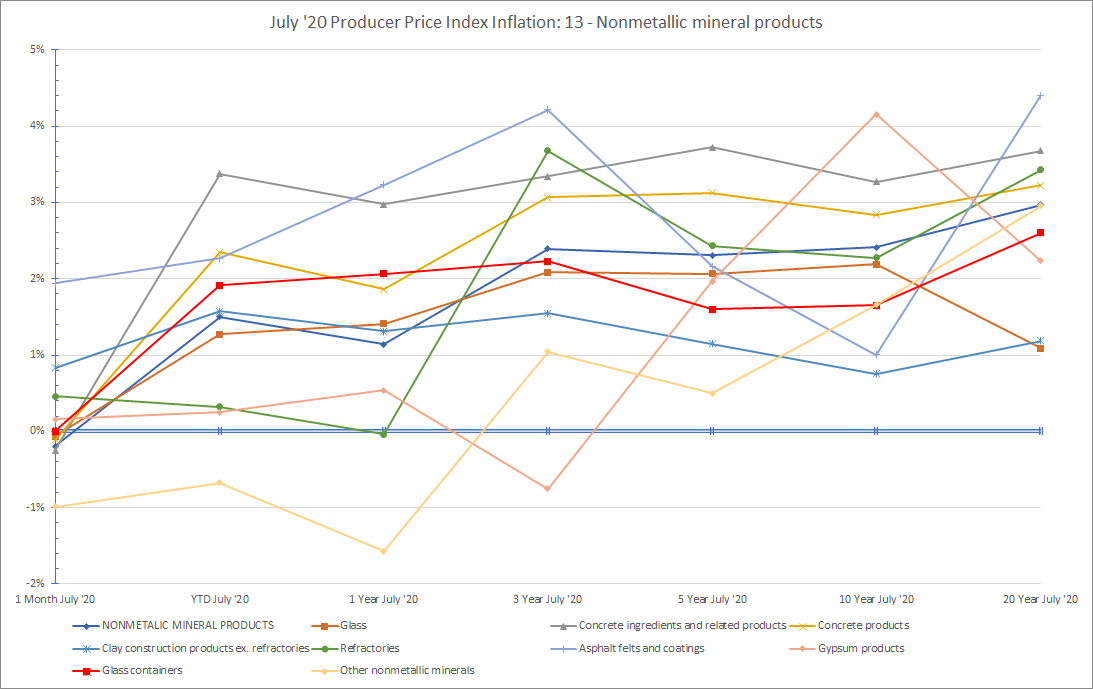
| 13 | NONMETALIC MINERAL PRODUCTS | -0.2% | 1.5% | 1.1% | 2.4% | 2.3% | 2.4% | 3.0% |
| 131 | Glass | -0.1% | 1.3% | 1.4% | 2.1% | 2.1% | 2.2% | 1.1% |
| 132 | Concrete ingredients and related products | -0.2% | 3.4% | 3.0% | 3.3% | 3.7% | 3.3% | 3.7% |
| 133 | Concrete products | -0.1% | 2.3% | 1.9% | 3.1% | 3.1% | 2.8% | 3.2% |
| 134 | Clay construction products ex. refractories | 0.8% | 1.6% | 1.3% | 1.5% | 1.1% | 0.8% | 1.2% |
| 135 | Refractories | 0.5% | 0.3% | 0.0% | 3.7% | 2.4% | 2.3% | 3.4% |
| 136 | Asphalt felts and coatings | 1.9% | 2.3% | 3.2% | 4.2% | 2.2% | 1.0% | 4.4% |
| 137 | Gypsum products | 0.2% | 0.3% | 0.5% | -0.8% | 2.0% | 4.2% | 2.2% |
| 138 | Glass containers | 0.0% | 1.9% | 2.1% | 2.2% | 1.6% | 1.6% | 2.6% |
| 139 | Other nonmetallic minerals | -1.0% | -0.7% | -1.6% | 1.0% | 0.5% | 1.7% | 3.0% |
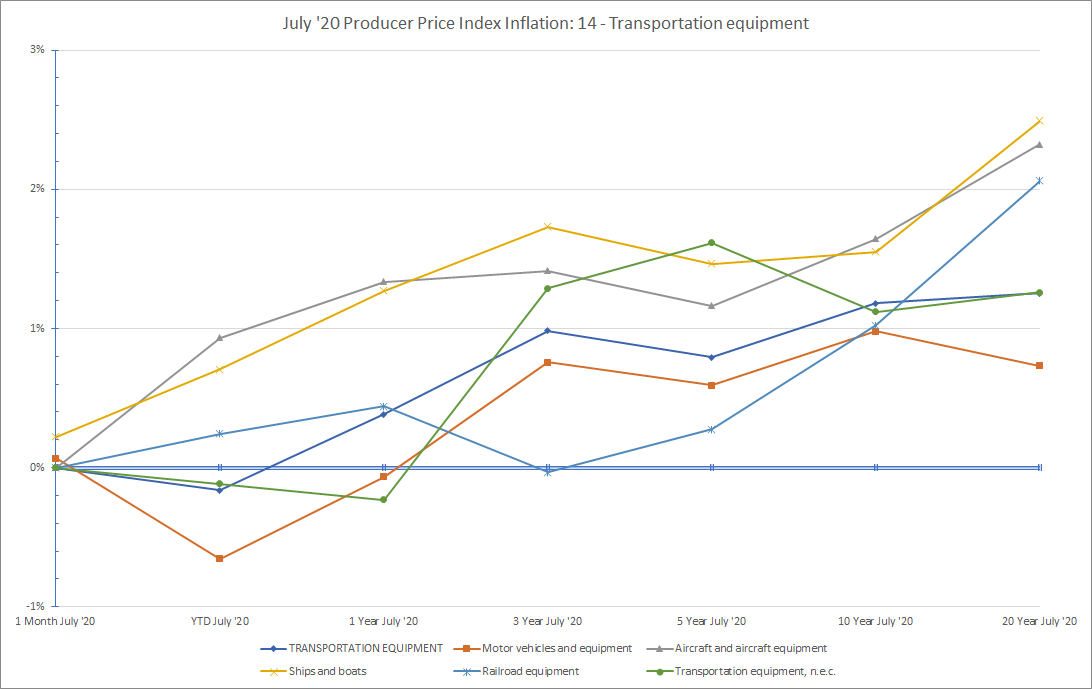
| 14 | TRANSPORTATION EQUIPMENT | 0.0% | -0.2% | 0.4% | 1.0% | 0.8% | 1.2% | 1.3% |
| 141 | Motor vehicles and equipment | 0.1% | -0.7% | -0.1% | 0.8% | 0.6% | 1.0% | 0.7% |
| 142 | Aircraft and aircraft equipment | 0.0% | 0.9% | 1.3% | 1.4% | 1.2% | 1.6% | 2.3% |
| 143 | Ships and boats | 0.2% | 0.7% | 1.3% | 1.7% | 1.5% | 1.5% | 2.5% |
| 144 | Railroad equipment | 0.0% | 0.2% | 0.4% | 0.0% | 0.3% | 1.0% | 2.1% |
| 149 | Transportation equipment, n.e.c. | 0.0% | -0.1% | -0.2% | 1.3% | 1.6% | 1.1% | 1.3% |
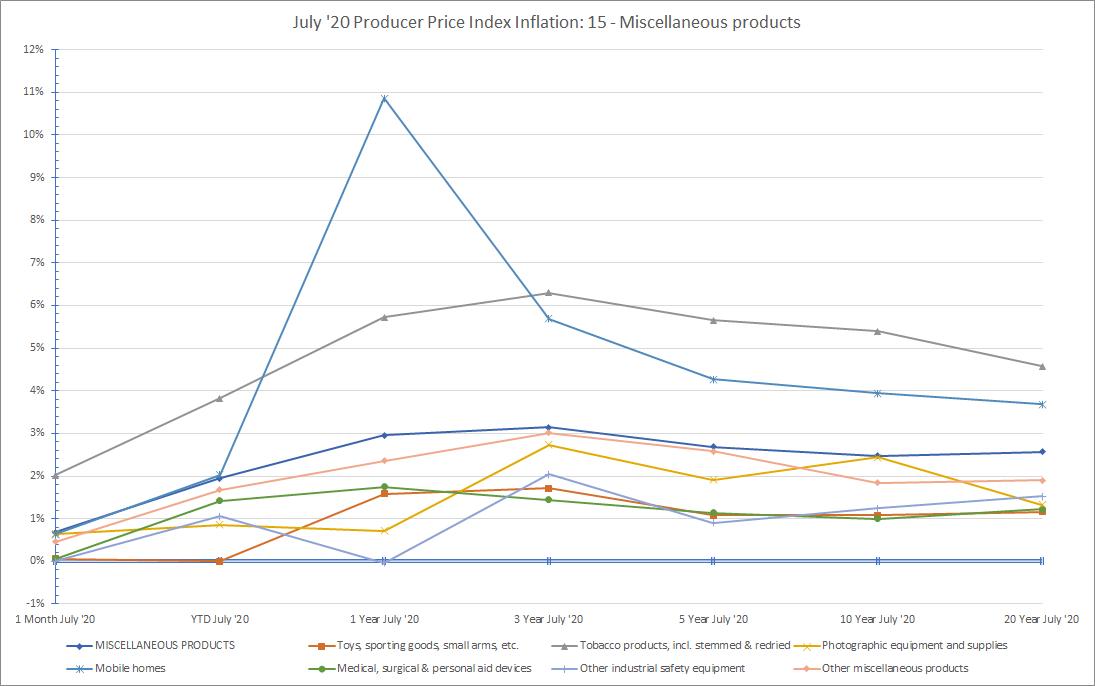
| 15 | MISCELLANEOUS PRODUCTS | 0.7% | 1.9% | 3.0% | 3.1% | 2.7% | 2.5% | 2.6% |
| 151 | Toys, sporting goods, small arms, etc. | 0.1% | 0.0% | 1.6% | 1.7% | 1.1% | 1.1% | 1.2% |
| 152 | Tobacco products, incl. stemmed & redried | 2.0% | 3.8% | 5.7% | 6.3% | 5.6% | 5.4% | 4.6% |
| 153 | Notions | 0.0% | 0.3% | 1.3% | 0.6% | 1.3% | 2.1% | 2.6% |
| 154 | Photographic equipment and supplies | 0.6% | 0.9% | 0.7% | 2.7% | 1.9% | 2.4% | 1.3% |
| 155 | Mobile homes | 0.6% | 2.0% | 10.9% | 5.7% | 4.3% | 3.9% | 3.7% |
| 156 | Medical, surgical & personal aid devices | 0.1% | 1.4% | 1.7% | 1.4% | 1.1% | 1.0% | 1.2% |
| 157 | Other industrial safety equipment | 0.0% | 1.1% | 0.0% | 2.0% | 0.9% | 1.2% | 1.5% |
| 159 | Other miscellaneous products | 0.5% | 1.7% | 2.4% | 3.0% | 2.6% | 1.8% | 1.9% |