The Bureau of Labor Statistics (BLS) released February 2020 Producer Price Indexes (PPI) today. All commodities saw a decrease of 1.4% over the last month and a decrease of 1.5% over the last year. Nonferrous metal ores increased by 1.4% over the last month & rose by 21.5% over the last year. From January 2020 to February 2020, tobacco products (including stemmed and redried) increased 0.9% & rose by 7% over the last year. Refractories saw an increase of 0.6% over the last month & 5.6% inflation over the last year. Refined sugar products & by-products increased by 1.2% between January 2020 and February 2020 & rose by 5.4% over the last year. Softwood lumber increased by 3.9% over the last month & rose by 4.6% over the last year. Ready-mix concrete saw a 0.9% increase from January and a 4.4% increase from February of 2019.
Bureau of Labor Statistics (BLS) Producer Price Indexes (PPI) Historical Annual Inflation Rate Averages Charts for Selected Commodities Through February 2020
Bureau of Labor Statistics (BLS) Producer Price Indexes (PPI) Historical Annual Inflation Rate Averages Table for Selected Commodities Through February 2020
| PPI Code | BLS PPI Category Description | 1 Month Feb. '20 | YTD Feb. '20 | 1 Year Feb. '20 | 3 Year Feb. '20 | 5 Year Feb. '20 | 10 Year Feb. '20 | 20 Year Feb. '20 |
|---|---|---|---|---|---|---|---|---|
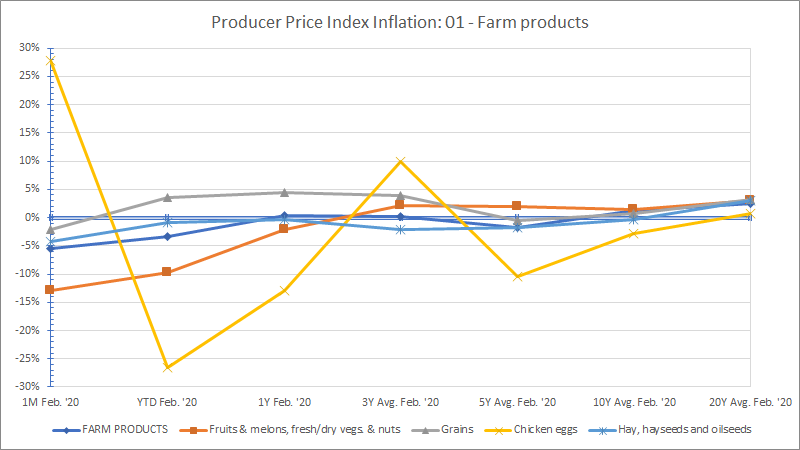
| 01 | FARM PRODUCTS | -5.5% | -3.3% | 0.4% | 0.2% | -1.7% | 1.2% | 2.5% |
| 011 | Fruits & melons, fresh/dry vegs. & nuts | -12.8% | -9.7% | -2.1% | 2.1% | 2.0% | 1.5% | 3.1% |
| 012 | Grains | -2.1% | 3.6% | 4.4% | 3.9% | -0.5% | 0.7% | 3.2% |
| 013 | Slaughter livestock | -2.2% | 0.9% | -1.2% | -1.8% | -4.9% | 3.0% | 2.4% |
| 014 | Slaughter poultry | -9.7% | -3.5% | -8.0% | -1.6% | -1.7% | 1.5% | 3.2% |
| 015 | Raw cotton | -4.3% | 3.5% | -2.6% | -4.2% | -0.6% | 0.6% | 0.8% |
| 016 | Raw milk | -7.7% | -9.2% | 14.7% | 1.0% | 1.7% | 0.9% | 2.1% |
| 017 | Chicken eggs | 27.8% | -26.5% | -12.9% | 9.9% | -10.4% | -2.9% | 0.6% |
| 018 | Hay, hayseeds and oilseeds | -4.3% | -0.8% | -0.4% | -2.0% | -1.8% | -0.3% | 3.1% |
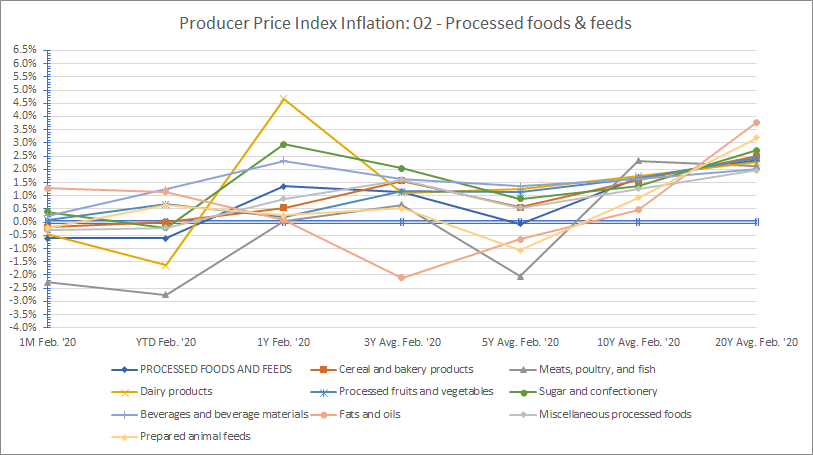
| 02 | PROCESSED FOODS AND FEEDS | -0.6% | -0.6% | 1.4% | 1.1% | -0.1% | 1.7% | 2.3% |
| 021 | Cereal and bakery products | -0.2% | 0.0% | 0.5% | 1.6% | 0.6% | 1.6% | 2.5% |
| 022 | Meats, poultry, and fish | -2.3% | -2.7% | 0.1% | 0.7% | -2.0% | 2.3% | 2.1% |
| 023 | Dairy products | -0.4% | -1.6% | 4.7% | 1.1% | 1.3% | 1.8% | 2.3% |
| 024 | Processed fruits and vegetables | 0.1% | 0.7% | 0.2% | 1.2% | 1.1% | 1.7% | 2.4% |
| 025 | Sugar and confectionery | 0.4% | -0.2% | 2.9% | 2.0% | 0.9% | 1.4% | 2.7% |
| 026 | Beverages and beverage materials | 0.2% | 1.2% | 2.3% | 1.6% | 1.3% | 1.6% | 2.0% |
| 027 | Fats and oils | 1.3% | 1.1% | 0.1% | -2.1% | -0.7% | 0.5% | 3.8% |
| 028 | Miscellaneous processed foods | -0.3% | -0.2% | 0.9% | 1.6% | 0.5% | 1.3% | 2.0% |
| 029 | Prepared animal feeds | -0.2% | 0.6% | 0.3% | 0.5% | -1.1% | 0.9% | 3.2% |
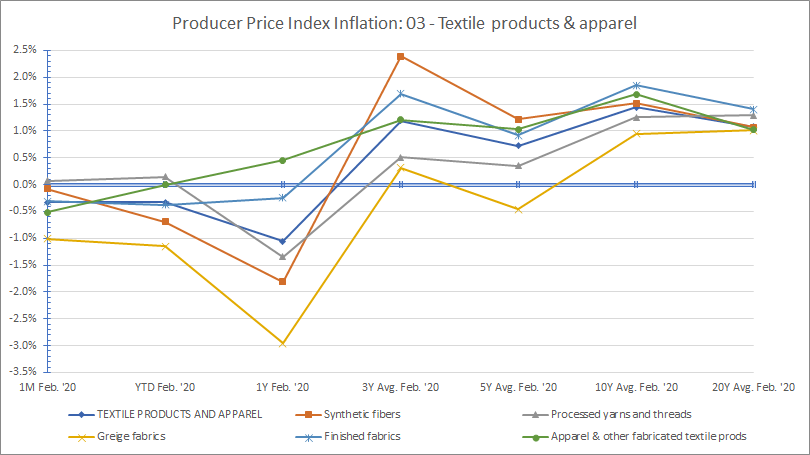
| 03 | TEXTILE PRODUCTS AND APPAREL | -0.3% | -0.3% | -1.1% | 1.2% | 0.7% | 1.4% | 1.1% |
| 031 | Synthetic fibers | -0.1% | -0.7% | -1.8% | 2.4% | 1.2% | 1.5% | 1.1% |
| 032 | Processed yarns and threads | 0.1% | 0.1% | -1.3% | 0.5% | 0.3% | 1.3% | 1.3% |
| 033 | Greige fabrics | -1.0% | -1.1% | -3.0% | 0.3% | -0.5% | 0.9% | 1.0% |
| 034 | Finished fabrics | -0.3% | -0.4% | -0.2% | 1.7% | 0.9% | 1.9% | 1.4% |
| 038 | Apparel & other fabricated textile prods | -0.5% | 0.0% | 0.5% | 1.2% | 1.0% | 1.7% | 1.0% |
| 039 | Miscellaneous textile products/services | -0.4% | -0.6% | -9.2% | -3.2% | -2.0% | -0.3% | 0.6% |
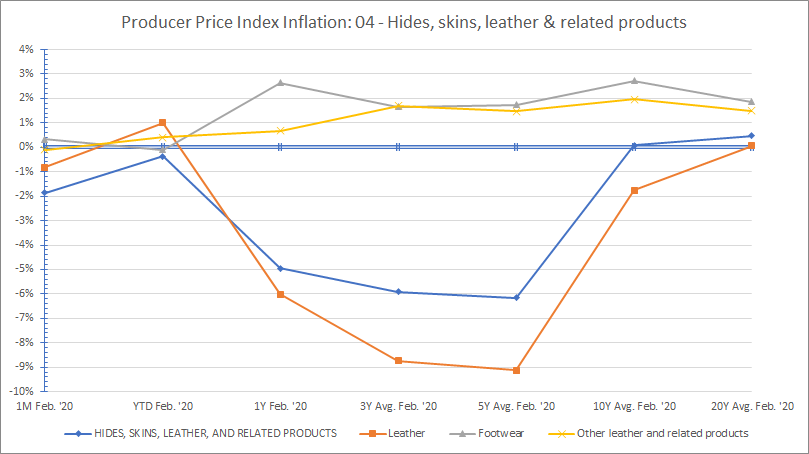
| 04 | HIDES, SKINS, LEATHER, AND RELATED PRODUCTS | -1.9% | -0.4% | -4.9% | -5.9% | -6.2% | 0.1% | 0.5% |
| 041 | Hides and skins, incl. cattle | -7.3% | -2.8% | -18.3% | -18.0% | -17.1% | -2.3% | -1.4% |
| 042 | Leather | -0.8% | 1.0% | -6.0% | -8.7% | -9.1% | -1.8% | 0.1% |
| 043 | Footwear | 0.3% | -0.1% | 2.6% | 1.7% | 1.7% | 2.7% | 1.9% |
| 044 | Other leather and related products | -0.1% | 0.4% | 0.7% | 1.7% | 1.5% | 2.0% | 1.5% |
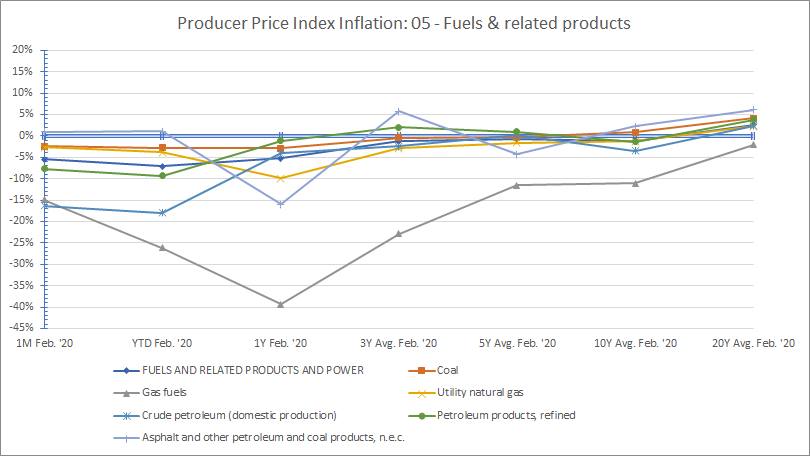
| 05 | FUELS AND RELATED PRODUCTS AND POWER | -5.4% | -7.1% | -5.2% | -1.3% | -0.6% | -1.1% | 2.6% |
| 051 | Coal | -2.4% | -2.8% | -2.9% | -0.5% | -0.3% | 0.8% | 4.1% |
| 053 | Gas fuels | -15.0% | -26.2% | -39.4% | -22.8% | -11.5% | -11.0% | -2.1% |
| 055 | Utility natural gas | -2.7% | -3.8% | -9.9% | -2.9% | -1.6% | -1.2% | 2.2% |
| 056 | Crude petroleum (domestic production) | -16.3% | -18.0% | -4.1% | -2.4% | 0.2% | -3.5% | 2.4% |
| 057 | Petroleum products, refined | -7.7% | -9.3% | -1.1% | 2.0% | 0.9% | -1.4% | 3.8% |
| 058 | Asphalt and other petroleum and coal products, n.e.c. | 0.9% | 1.0% | -16.0% | 5.7% | -4.3% | 2.3% | 6.0% |
| 06 | CHEMICALS AND ALLIED PRODUCTS | -0.5% | 0.4% | -2.3% | 1.2% | 1.4% | 1.9% | 3.3% |
| 061 | Industrial chemicals | -1.6% | -0.4% | -5.2% | -0.3% | 0.0% | -0.5% | 3.3% |
| 062 | Paints and allied products | 0.0% | 0.0% | 1.5% | 3.6% | 1.2% | 2.3% | 3.3% |
| 063 | Drugs and pharmaceuticals | 0.1% | 2.0% | 2.1% | 3.5% | 4.8% | 5.2% | 4.5% |
| 064 | Fats and oils, inedible | -2.4% | 2.9% | 5.6% | -4.3% | -1.7% | -0.9% | 5.1% |
| 065 | Agricultural chemicals and chemical products | 0.4% | -1.9% | -13.6% | 0.4% | -2.6% | 1.1% | 2.6% |
| 066 | Plastic resins and materials | 0.0% | -0.7% | -7.5% | -0.6% | -2.1% | 0.8% | 2.4% |
| 067 | Other chemicals and allied products | 0.0% | 0.1% | 0.4% | 1.7% | 1.4% | 1.7% | 2.1% |
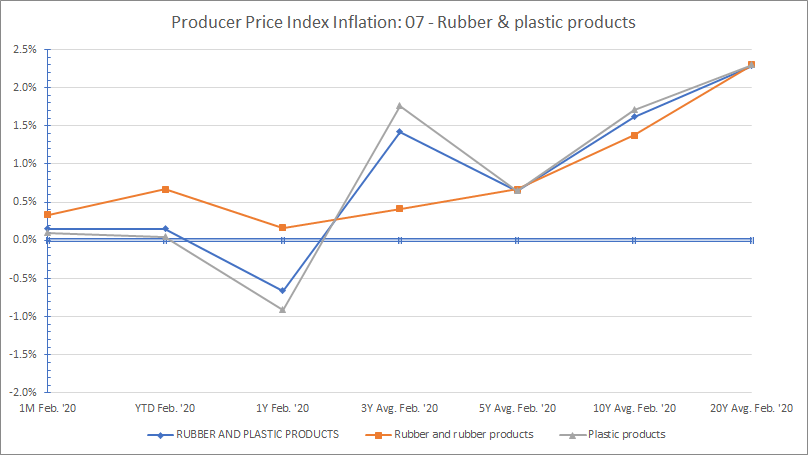
| 07 | RUBBER AND PLASTIC PRODUCTS | 0.2% | 0.2% | -0.7% | 1.4% | 0.6% | 1.6% | 2.3% |
| 071 | Rubber and rubber products | 0.3% | 0.7% | 0.2% | 0.4% | 0.7% | 1.4% | 2.3% |
| 072 | Plastic products | 0.1% | 0.0% | -0.9% | 1.8% | 0.6% | 1.7% | 2.3% |
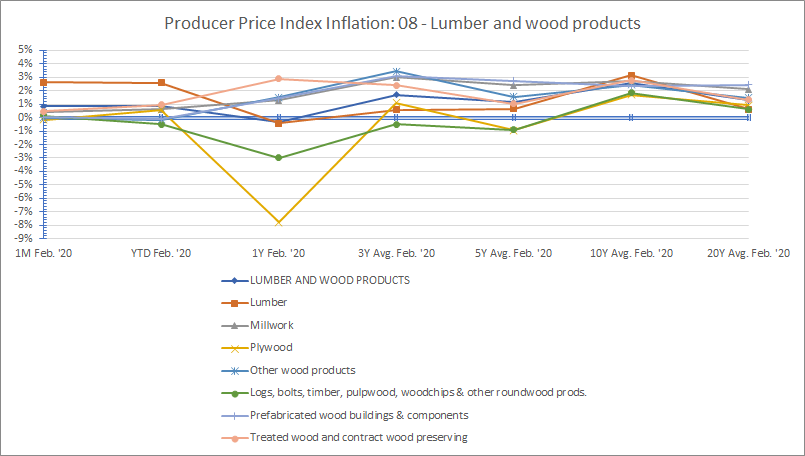
| 08 | LUMBER AND WOOD PRODUCTS | 0.8% | 0.8% | -0.3% | 1.7% | 1.1% | 2.5% | 1.3% |
| 081 | Lumber | 2.6% | 2.6% | -0.4% | 0.6% | 0.7% | 3.2% | 0.6% |
| 082 | Millwork | 0.4% | 0.6% | 1.3% | 3.0% | 2.4% | 2.7% | 2.1% |
| 083 | Plywood | -0.2% | 0.6% | -7.8% | 1.1% | -0.9% | 1.7% | 0.9% |
| 084 | Other wood products | 0.0% | -0.2% | 1.5% | 3.4% | 1.5% | 2.5% | 1.5% |
| 085 | Logs, bolts, timber, pulpwood, woodchips and other roundwood products | 0.1% | -0.5% | -3.0% | -0.5% | -0.9% | 1.8% | 0.6% |
| 086 | Prefabricated wood buildings & components | 0.0% | -0.1% | 1.4% | 3.1% | 2.7% | 2.4% | 2.4% |
| 087 | Treated wood and contract wood preserving | 0.5% | 0.9% | 2.9% | 2.4% | 1.0% | 2.8% | 1.3% |
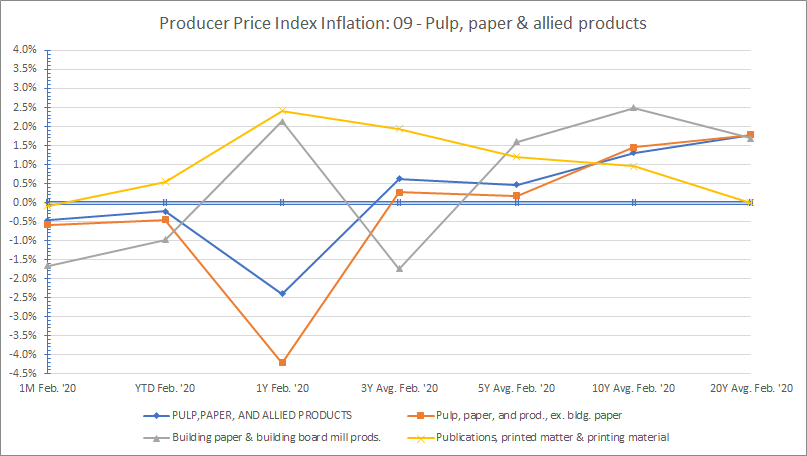
| 09 | PULP,PAPER, AND ALLIED PRODUCTS | -0.5% | -0.2% | -2.4% | 0.6% | 0.5% | 1.3% | 1.8% |
| 091 | Pulp, paper, and prod., ex. bldg. paper | -0.6% | -0.4% | -4.2% | 0.3% | 0.2% | 1.5% | 1.8% |
| 092 | Building paper & building board mill prods. | -1.7% | -1.0% | 2.1% | -1.7% | 1.6% | 2.5% | 1.7% |
| 094 | Publications, printed matter & printing material | -0.1% | 0.5% | 2.4% | 1.9% | 1.2% | 1.0% | |
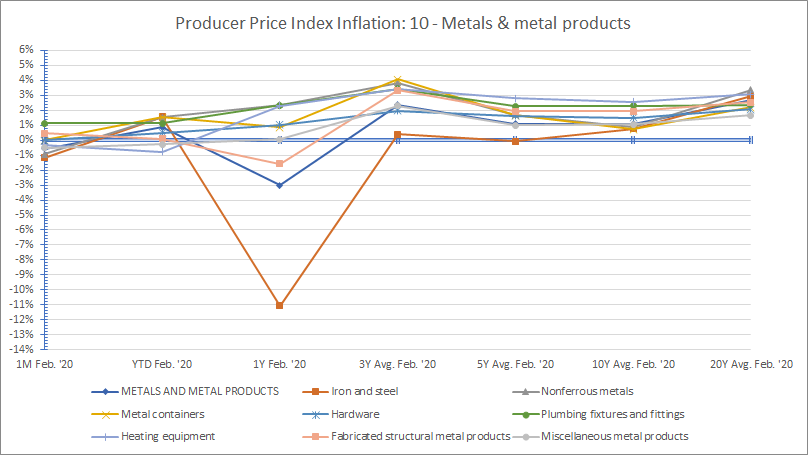
| 10 | METALS AND METAL PRODUCTS | -0.6% | 0.9% | -3.0% | 2.4% | 1.1% | 1.1% | 2.7% |
| 101 | Iron and steel | -1.2% | 1.6% | -11.1% | 0.4% | -0.1% | 0.8% | 2.9% |
| 102 | Nonferrous metals | -0.9% | 1.5% | 2.4% | 3.8% | 1.7% | 0.9% | 3.4% |
| 103 | Metal containers | 0.0% | 1.5% | 0.9% | 4.1% | 1.7% | 0.7% | 2.2% |
| 104 | Hardware | 0.0% | 0.5% | 1.0% | 1.9% | 1.6% | 1.5% | 2.1% |
| 105 | Plumbing fixtures and fittings | 1.1% | 1.1% | 2.3% | 3.4% | 2.3% | 2.3% | 2.4% |
| 106 | Heating equipment | -0.3% | -0.8% | 2.3% | 3.4% | 2.8% | 2.6% | 3.1% |
| 107 | Fabricated structural metal products | 0.5% | 0.1% | -1.6% | 3.3% | 1.9% | 1.9% | 2.5% |
| 108 | Miscellaneous metal products | -0.5% | -0.3% | 0.1% | 2.3% | 1.0% | 1.1% | 1.7% |
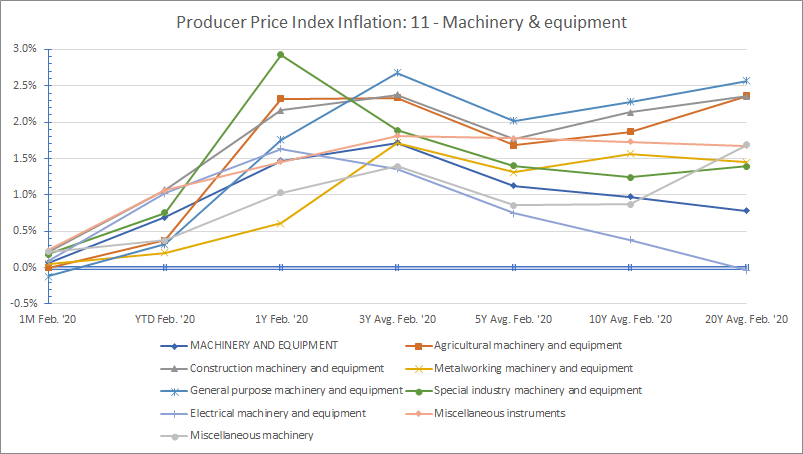
| 11 | MACHINERY AND EQUIPMENT | 0.1% | 0.7% | 1.5% | 1.7% | 1.1% | 1.0% | 0.8% |
| 111 | Agricultural machinery and equipment | 0.0% | 0.4% | 2.3% | 2.3% | 1.7% | 1.9% | 2.4% |
| 112 | Construction machinery and equipment | 0.2% | 1.1% | 2.2% | 2.4% | 1.8% | 2.1% | 2.4% |
| 113 | Metalworking machinery and equipment | 0.1% | 0.2% | 0.6% | 1.7% | 1.3% | 1.6% | 1.4% |
| 114 | General purpose machinery and equipment | -0.1% | 0.3% | 1.8% | 2.7% | 2.0% | 2.3% | 2.6% |
| 115 | Electronic computers and computer equipment | 0.4% | -1.5% | -4.8% | -2.0% | -2.7% | -3.6% | -6.0% |
| 116 | Special industry machinery and equipment | 0.2% | 0.8% | 2.9% | 1.9% | 1.4% | 1.2% | 1.4% |
| 117 | Electrical machinery and equipment | 0.1% | 1.0% | 1.6% | 1.4% | 0.7% | 0.4% | 0.0% |
| 118 | Miscellaneous instruments | 0.2% | 1.1% | 1.5% | 1.8% | 1.8% | 1.7% | 1.7% |
| 119 | Miscellaneous machinery | 0.2% | 0.4% | 1.0% | 1.4% | 0.9% | 0.9% | 1.7% |
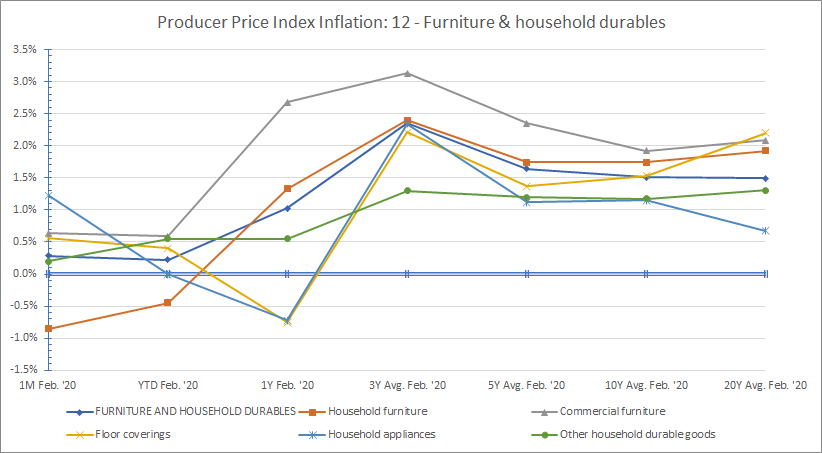
| 12 | FURNITURE AND HOUSEHOLD DURABLES | 0.3% | 0.2% | 1.0% | 2.4% | 1.6% | 1.5% | 1.5% |
| 121 | Household furniture | -0.9% | -0.4% | 1.3% | 2.4% | 1.7% | 1.7% | 1.9% |
| 122 | Commercial furniture | 0.6% | 0.6% | 2.7% | 3.1% | 2.4% | 1.9% | 2.1% |
| 123 | Floor coverings | 0.6% | 0.4% | -0.8% | 2.2% | 1.4% | 1.5% | 2.2% |
| 124 | Household appliances | 1.2% | 0.0% | -0.7% | 2.3% | 1.1% | 1.2% | 0.7% |
| 125 | Home electronic equipment | 0.0% | 0.6% | 2.5% | 0.8% | 0.6% | 0.0% | -1.6% |
| 126 | Other household durable goods | 0.2% | 0.6% | 0.6% | 1.3% | 1.2% | 1.2% | 1.3% |
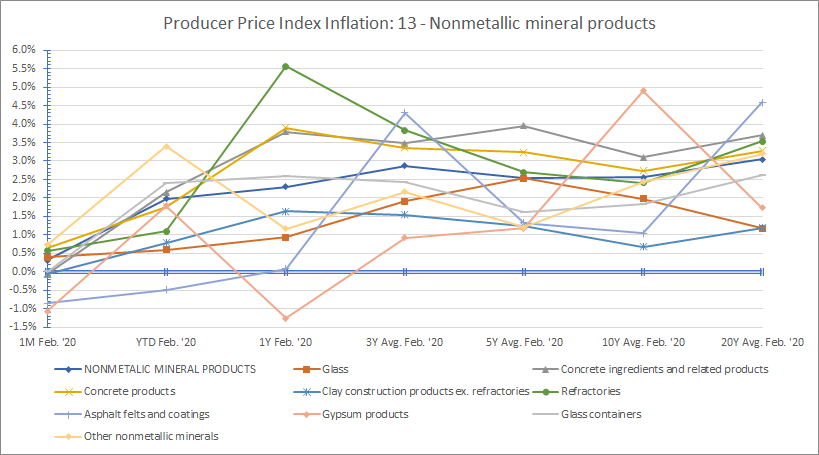
| 13 | NONMETALIC MINERAL PRODUCTS | 0.3% | 2.0% | 2.3% | 2.9% | 2.5% | 2.6% | 3.0% |
| 131 | Glass | 0.4% | 0.6% | 0.9% | 1.9% | 2.5% | 2.0% | 1.2% |
| 132 | Concrete ingredients and related products | -0.1% | 2.2% | 3.8% | 3.5% | 4.0% | 3.1% | 3.7% |
| 133 | Concrete products | 0.7% | 1.8% | 3.9% | 3.4% | 3.2% | 2.7% | 3.3% |
| 134 | Clay construction products ex. refractories | -0.1% | 0.8% | 1.6% | 1.5% | 1.2% | 0.7% | 1.2% |
| 135 | Refractories | 0.6% | 1.1% | 5.6% | 3.8% | 2.7% | 2.4% | 3.5% |
| 136 | Asphalt felts and coatings | -0.8% | -0.5% | 0.1% | 4.3% | 1.3% | 1.0% | 4.6% |
| 137 | Gypsum products | -1.1% | 1.8% | -1.3% | 0.9% | 1.2% | 4.9% | 1.7% |
| 138 | Glass containers | 0.0% | 2.4% | 2.6% | 2.4% | 1.6% | 1.8% | 2.6% |
| 139 | Other nonmetallic minerals | 0.7% | 3.4% | 1.2% | 2.2% | 1.2% | 2.4% | 3.2% |
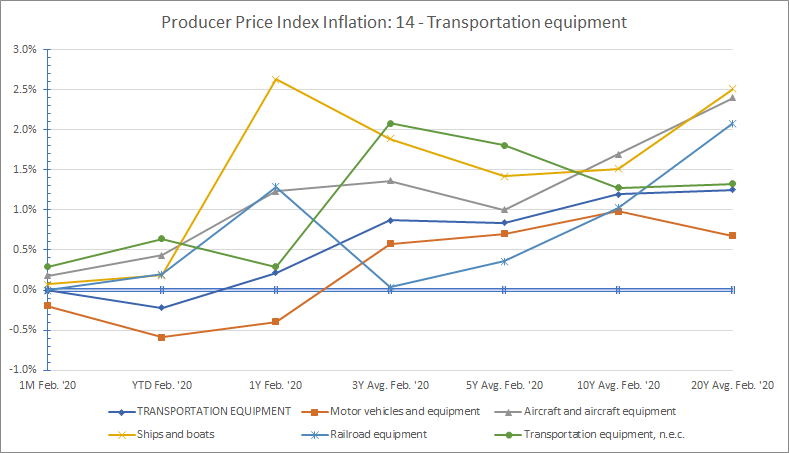
| 14 | TRANSPORTATION EQUIPMENT | 0.0% | -0.2% | 0.2% | 0.9% | 0.8% | 1.2% | 1.3% |
| 141 | Motor vehicles and equipment | -0.2% | -0.6% | -0.4% | 0.6% | 0.7% | 1.0% | 0.7% |
| 142 | Aircraft and aircraft equipment | 0.2% | 0.4% | 1.2% | 1.4% | 1.0% | 1.7% | 2.4% |
| 143 | Ships and boats | 0.1% | 0.2% | 2.6% | 1.9% | 1.4% | 1.5% | 2.5% |
| 144 | Railroad equipment | 0.0% | 0.2% | 1.3% | 0.0% | 0.4% | 1.0% | 2.1% |
| 149 | Transportation equipment, n.e.c. | 0.3% | 0.6% | 0.3% | 2.1% | 1.8% | 1.3% | 1.3% |
| 15 | MISCELLANEOUS PRODUCTS | 0.2% | 0.5% | 3.1% | 2.9% | 2.5% | 2.5% | 2.5% |
| 151 | Toys, sporting goods, small arms, etc. | 0.1% | -0.2% | 2.4% | 1.6% | 1.1% | 1.2% | 1.1% |
| 152 | Tobacco products, incl. stemmed & redried | 0.9% | 0.9% | 7.0% | 6.0% | 5.5% | 5.4% | 4.3% |
| 153 | Notions | -0.3% | -0.2% | 1.3% | 1.2% | 1.3% | 2.1% | 2.5% |
| 154 | Photographic equipment and supplies | 0.1% | 0.1% | 5.5% | 2.6% | 1.7% | 2.4% | 1.3% |
| 155 | Mobile homes | -0.2% | -0.3% | 9.1% | 5.7% | 4.0% | 3.8% | 3.6% |
| 156 | Medical, surgical & personal aid devices | -0.4% | 0.0% | 0.9% | 0.9% | 0.8% | 0.9% | 1.2% |
| 157 | Other industrial safety equipment | 0.0% | 0.9% | 0.1% | 0.4% | 0.8% | 1.3% | 1.5% |
| 159 | Other miscellaneous products | 0.6% | 1.1% | 2.1% | 3.3% | 2.4% | 2.0% | 1.9% |
CPI vs. PPI Supermarket Inflation Comparison Through February 2020
| Inflation Rate Period | PPI Inflation | CPI Inflation | DIFF: PPI vs. CPI |
|---|---|---|---|
| 2 Months Ended February '20 | -0.10% | 0.63% | -0.73% |
| 1 Month Ended January '20 | 0.45% | 0.27% | 0.18% |
| 12 Months Ended December '19 | 1.29% | 0.85% | 0.44% |
| 12 Months Ended December '18 | 2.85% | 0.41% | 2.44% |
| 12 Months Ended December '17 | 2.85% | 0.47% | 2.39% |
| 12 Months Ended December '16 | 1.32% | 0.10% | 1.22% |
| 12 Months Ended December '15 | 0.19% | 0.11% | 0.08% |
| 12 Months Ended December '14 | 5.07% | 2.46% | 2.61% |
| 12 Months Ended December '13 | 2.04% | 0.14% | 1.90% |
| 12 Months Ended December '12 | 2.72% | 1.00% | 1.71% |
| 12 Months Ended December '11 | 5.20% | 4.07% | 1.13% |
| 12 Months Ended December '10 | 2.92% | 0.90% | 2.03% |
| 3 Year Average Ended Dec. '19 | 2.33% | 0.57% | 1.76% |
| 5 Year Average Ended Dec. '19 | 1.70% | 0.39% | 1.31% |
| 10 Year Average Ended Dec. '19 | 2.65% | 1.05% | 1.60% |
Rates are representative of a supermarket’s actual inventory balances, product mix & applicable BLS categories; inflation rates calculated using a supermarket that has the following departments: bakery, beer/wine, dairy, deli, frozen foods, gen. merch., grocery, health & beauty aids, meat, pharmacy, produce & tobacco. PPI inflation calculated uses BLS Table 9 preliminary indexes; CPI inflation calculated uses U.S. City averages for all urban consumers, seasonally unadjusted.
PPI BLS Economic News Release BLS PPI Table 9 Detailed Report BLS PPI Table 11 Detailed Report Good LIFO Candidates