The Bureau of Labor Statistics (BLS) released April 2020 Consumer Price Indexes (CPI) today. The All commodities index decreased 0.7% over the last month & has increased 0.3% over the last year on a seasonally unadjusted basis. All items less food and energy decreased 0.5% from March – April 2020 & rose 1.4% between April ’19 – ’20. Commodities less food and energy commodities saw a 0.9% decrease from April of 2019 to April 2020 and decreased 0.8% in the last month. Food increased 1.5% over the last month & rose 3.5% over the last year. Meats, poultry, fish and eggs rose 4.5% between March and April 2020 & and increased by 6.8% between April ’19 – ’20. Household paper products increased by 4.5% from March to April of this year and rose by 6.3% from April ’19 – ’20. Crackers, bread and cracker products increased by 3.9% from March to April 2020 and rose by 6.4% from April ’19 – ’20. Carbonated drinks rose by 3.5% over the last month and increased by 6.6% over the last year. Juice and non alcoholic drinks rose 6.2% from April 2019 – April 2020 and had a 3.4% increase in the last month. Processed fruits and vegetables saw a 2.7% rise from March 2020 and a 4% increase from April of 2019. Sugar & sugar substitutes had an 8.2% increase in the last year and a 2.4% rise since March 2019. Cheese and cheese related products had a 1.8% rise in the last month and a 7% increase from April 2019. Dairy and related products rose 5.2% between April 2019 and April 2020 and a 1.4% increase from March 2020.
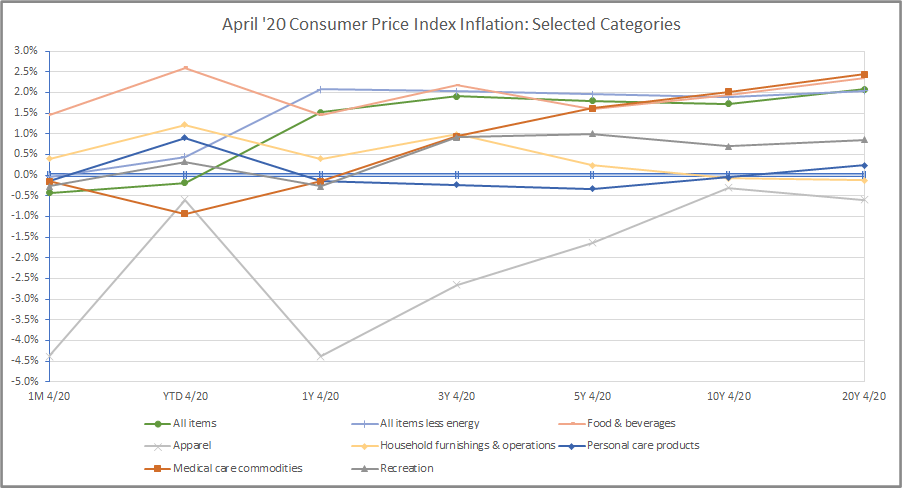
BLS CPI Historical Annual Inflation Rate Averages Through April 2020 Charts For Selected Categories
| BLS CPI Code | BLS CPI Category Description | 1M 4/20 | YTD 4/20 | 1Y 4/20 | 3Y 4/20 | 5Y 4/20 | 10Y 4/20 | 20Y 4/20 |
|---|---|---|---|---|---|---|---|---|
| SAF | FOOD & BEVERAGES | 1.5% | 2.6% | 1.5% | 2.2% | 1.6% | 1.9% | 2.4% |
| SAF11 | Food at home | 2.7% | 4.1% | 2.7% | 1.8% | 0.8% | 1.6% | 2.1% |
| SAF114 | Nonalcoholic beverages & beverage materials | 2.7% | 5.4% | 2.7% | 2.1% | 1.3% | 1.0% | 1.3% |
| SEFN | Juices & nonalcoholic drinks | 3.4% | 6.2% | 3.4% | 3.0% | 1.9% | 1.2% | 1.5% |
| SEFN01 | Carbonated drinks | 3.5% | 9.0% | 3.5% | 3.8% | 2.7% | 1.5% | 2.0% |
| SEFN03 | Nonfrozen noncarbonated juices & drinks | 3.3% | 4.4% | 3.3% | 2.5% | 1.4% | 1.0% | 1.0% |
| SEFP | Beverage materials including coffee & tea | 1.2% | 3.4% | 1.2% | -0.1% | -0.4% | 0.5% | 0.9% |
| SEFP01 | Coffee | 1.1% | 4.0% | 1.1% | -0.9% | -1.3% | 0.7% | 1.1% |
| SEFP02 | Other beverage materials including tea | 1.5% | 2.4% | 1.5% | 1.3% | 1.0% | 0.6% | 1.1% |
| SAF115 | Other food at home | 2.2% | 4.2% | 2.2% | 1.3% | 1.0% | 1.4% | 1.8% |
| SEFT06 | Other miscellaneous foods | 2.9% | 1.9% | 2.9% | 1.4% | 1.0% | 1.2% | 1.4% |
| SEFW | Alcoholic beverages at home | 0.5% | 2.4% | 0.5% | 1.4% | 1.2% | 1.0% | 1.4% |
| SEFW01 | Beer, ale & other malt beverages at home | 1.5% | 3.6% | 1.5% | 2.5% | 2.3% | 1.9% | 2.2% |
| SEFW02 | Distilled spirits at home | 0.4% | 1.9% | 0.4% | 0.3% | 0.3% | 0.4% | 1.0% |
| SEFW03 | Wine at home | -0.3% | 1.6% | -0.3% | 0.6% | 0.3% | 0.1% | 0.6% |
| SEHE | FUEL OIL & OTHER FUELS | -10.8% | -23.1% | -10.8% | -4.4% | -3.9% | -2.3% | 3.0% |
| SAH3 | HOUSEHOLD FURNISHINGS & OPERATIONS | 0.4% | 1.2% | 0.4% | 1.0% | 0.2% | -0.1% | -0.1% |
| SAA | APPAREL | -4.4% | -0.6% | -4.4% | -2.7% | -1.6% | -0.3% | -0.6% |
| SAM1 | MEDICAL CARE COMMODITIES | -0.2% | -0.9% | -0.2% | 0.9% | 1.6% | 2.0% | 2.4% |
| SEMF | Medicinal drugs | -0.1% | -0.9% | -0.1% | 1.0% | 1.7% | 2.1% | |
| SEMF01 | Prescription drugs | 0.0% | -0.8% | 0.0% | 1.3% | 2.2% | 2.8% | 3.2% |
| SEMF02 | Nonprescription drugs | -0.5% | -1.2% | -0.5% | -0.5% | -0.4% | -0.5% | |
| SEMG | Medical equipment and supplies | -0.6% | -2.0% | -0.6% | 0.2% | 0.1% | 0.2% | |
| SAR | RECREATION | -0.3% | 0.3% | -0.3% | 0.9% | 1.0% | 0.7% | 0.9% |
| SEEA | EDUCATIONAL BOOKS & SUPPLIES | 0.9% | -0.6% | 0.9% | -0.6% | 1.0% | 3.1% | 4.6% |
| SEGA | TOBACCO & SMOKING PRODUCTS | -0.2% | 1.6% | -0.2% | 4.2% | 4.8% | 3.9% | 5.4% |
| SEGB | PERSONAL CARE PRODUCTS | -0.1% | 0.9% | -0.1% | -0.2% | -0.3% | 0.0% | 0.2% |
| SEGE | MISCELLANEOUS PERSONAL GOODS | 1.4% | 4.2% | 1.4% | 0.5% | -1.1% | -1.2% | -1.1% |
| SAG | OTHER GOODS AND SERVICES | 0.0% | 1.3% | 0.0% | 2.2% | 2.3% | 2.0% | 2.7% |
| SERE | Other recreational goods | -0.9% | -1.0% | -0.9% | -6.7% | -6.8% | -5.5% | -4.7% |
| SERG | Recreational reading materials | -0.8% | 0.7% | -0.8% | 2.5% | 1.8% | 1.6% | 1.7% |
CPI vs. PPI Supermarket Inflation Comparison Through March 2020
| PPI Inflation | CPI Inflation | DIFF: PPI vs. CPI |
| -0.33% | 2.41% | -2.74% |
| 0.04% | 0.87% | -0.83% |
| -0.10% | 0.63% | -0.73% |
| 0.45% | 0.27% | 0.18% |
| 1.29% | 0.85% | 0.44% |
| 2.85% | 0.41% | 2.44% |
| 2.85% | 0.47% | 2.39% |
| 1.32% | 0.10% | 1.22% |
| 0.19% | 0.11% | 0.08% |
| 5.07% | 2.46% | 2.61% |
| 2.04% | 0.14% | 1.90% |
| 2.72% | 1.00% | 1.71% |
| 5.20% | 4.07% | 1.13% |
| 2.92% | 0.90% | 2.03% |
| 2.33% | 0.57% | 1.76% |
| 1.70% | 0.39% | 1.31% |
| 2.65% | 1.05% | 1.60% |