Bob Richardson

LIFO Tax Incentive Opportunities Abound

LIFO is the most valuable inventory-related tax incentive for companies with inflation. LIFOPro publishes our top LIFO candidates blog annually at the end of the year to help CPA firms & companies considering electing LIFO both identify if they’re a good LIFO candidate and if the current inflation environment favors making a LIFO election for the next year end. The timing is key when considering electing LIFO, so it’s important to attempt to forecast the year end inflation environment in order to quantify the current year tax savings that LIFO may provide. Using both industry & commodity pricing data published by the Producer Price Index (PPI) division of the Bureau Labor of Statistics, LIFOPro has performed extensive analysis to identify the best prospects for LIFO.

Effect of Inflation on the Balance Sheet & Income Statement

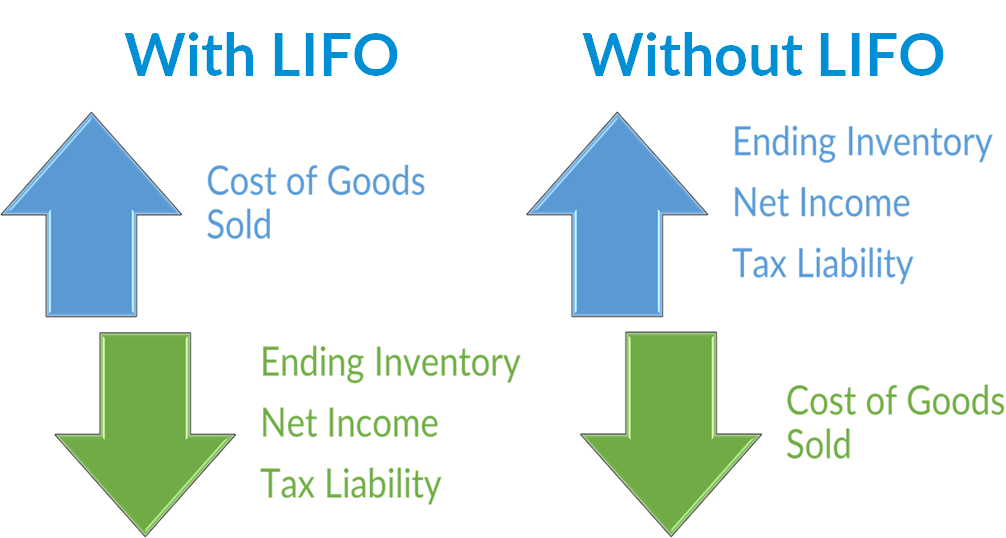
How LIFO Creates Real After Tax Cash Savings

  • More accurately reflects income by matching current costs against current revenues
  • Eliminates artificial profits from earnings resulting from inflationary increases in inventory costs
  • Transfers artificially inflated ending inventory values from the balance sheet to the income statement
  • Increases cost of goods sold & reduces ending inventory balances in periods of inflation
  • Reduces taxable income in periods of inflation & creates material long-term after-tax cash savings
  • Inventories maintained at same costs historically used & annual side calculation made to adjust inventories at cost (i.e. FIFO or average cost) to LIFO cost using contra inventory account called LIFO reserve
  • Subsequent period’s LIFO benefits build upon those of the prior period (change in CY vs. PY LIFO reserve called LIFO expense (income); expense means CY vs. PY LIFO reserve increased. Income means reserve decreased.)
  • Benefits grow in perpetuity & only decreases when there’s deflation or substantial inventory liquidation

Related: How LIFO Works

Quick LIFO Tax Savings Formula

  • CY Taxable Income Reduction From LIFO (i.e. CY LIFO expense): CY inflation rate * PY ending inventory balance @ cost (i.e. FIFO, average cost)
  • CY After Tax Cash Savings From LIFO: CY LIFO expense * tax rate

LIFO Tax Savings Example

  • Inputs
    • CY inflation rate: 2.5%
    • Prior year end inventory balance at FIFO cost: $10M
    • Tax rate: 30%
  • Outputs
    • CY LIFO expense: 2.5% * $10M = $250K
    • CY After Tax Cash Savings: $250K * 30% = $75K

2020 Top LIFO Candidates

LIFOPro’s top LIFO candidates are organized into the following two groupings:

  • Industry-based: IRS primary business activities or PBAs & their corresponding BLS PPI Table 11 industry-based indexes (126 total inventory-based PBAs)
  • Commodity-based: BLS PPI Table 9 commodity-based indexes (approximately 3,700 total commodity based indexes). Separated into the following two groups:
    • Major Commodity Group: 2-digit top-level groupings of the BLS PPI Table 9 commodity-based hierarchy (15 commodity-based 2-digit Table 9 PPI major commodity groups)
    • More-detailed Commodity Group: 3+ digit lower-level groupings of the BLS Table 9 commodity-based hierarchy. Includes:
      • 3-digit subgroups
      • 4-digit product classes
      • 5 & 6-digit subproduct classes
      • 7-digit item groupings
      • 8+ digits: individual items

2020 Top LIFO Candidate Criteria

LIFOPro requires for the following criteria to be met to make our 2020 list:

  • Must have year to date inflation of greater than 1% (YTD = 9 months ended September ’20 or Sep. ’20 ÷ Dec. ’19 PPI)
  • Must be considered a good LIFO candidate in general, which takes into account the following factors:
    • 50% or more of the historical 3, 5, 10 or 20 year average annual inflation rate must be inflationary: Using the compound inflation formula, LIFOPro calculates the 3,5,10 & 20 year average annual inflation rates for all industries & commodities tracked by the BLS.
    • Historical average annual inflation rate of 1% or greater: This will be the historical 3, 5, 10, or 20 year average annual inflation rate that spans the longest period of time for any given industry or commodity (will be the 20 year average annual inflation rate for most, but some will be the 3, 5 or 10 year average as certain industries/commodities were not published by the BLS until more recently)
    • Overall inflation frequency of 50% or more: Using 12 months ended December BLS price indexes published for each of the past 20 year, LIFOPro measures how many of those periods resulted in inflation for any given industry or commodity
    • Inflation frequency rate of greater than 50% (11 or more of 20 periods from 2000 – 2019)

Related: Good LIFO Candidates

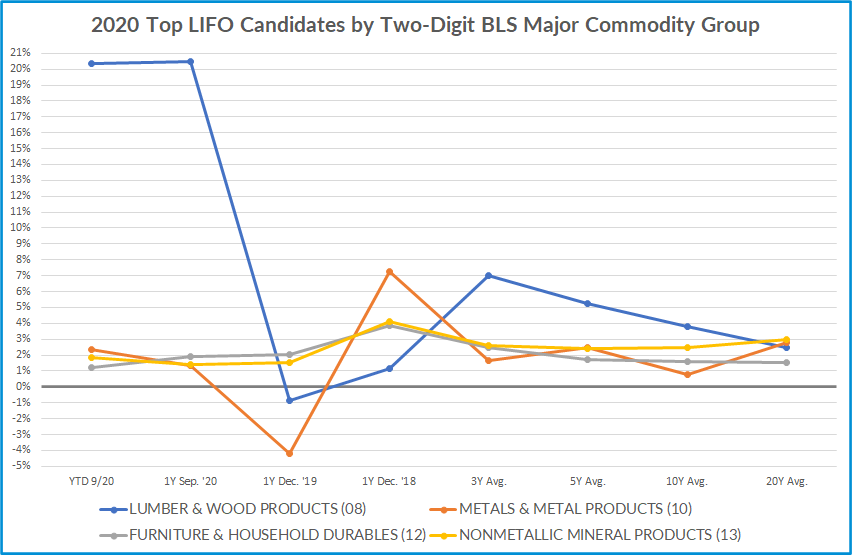
2020 Top LIFO Candidates by Commodity Chart: Two-digit Major Commodity Group

2021 Top LIFO Candidates by Commodity Table: Three-digit Subgroup

BLS PPI CodeBLS PPI Category DescriptionYTD 08/211Y Aug. '211Y Dec. '201Y Dec. '193Y Avg.5Y Avg.10Y Avg.20Y Avg.# Yrs w Infl.# Yrs Index Publ.# Yrs. w/ Infl. Freq.Hist. Avg. Inf. Freq.
021Cereal & bakery products5.6%4.0%0.1%0.5%2.5%2.1%1.3%2.7%162080%100%
023Dairy products2.5%-0.8%-3.0%7.7%2.3%1.1%-0.1%1.7%112055%75%
024Processed fruits & vegetables2.0%2.2%3.8%-0.8%2.1%2.0%1.7%2.7%172085%100%
028Miscellaneous processed foods3.5%0.9%1.2%-1.0%1.9%2.0%1.5%2.1%162080%100%
029Prepared animal feeds8.9%19.5%9.6%0.5%4.7%3.0%0.8%4.0%152075%100%
032Processed yarns & threads17.8%16.5%-2.0%-4.3%3.4%3.9%0.1%2.1%132065%100%
033Greige fabrics8.9%4.7%-1.1%-2.0%2.1%1.8%-0.1%1.4%112055%75%
034Finished fabrics9.4%9.9%1.8%1.4%4.8%3.2%1.7%1.9%142070%100%
038Apparel & other fabricated textile prods3.7%2.5%-0.1%1.3%1.7%1.5%1.5%1.2%162080%100%
043Footwear2.8%2.8%-0.2%3.3%1.9%1.5%2.5%2.0%182090%100%
044Other leather & related products2.0%1.6%1.1%1.1%1.4%1.5%2.1%1.6%192095%100%
057Petroleum products, refined52.6%72.2%-15.3%4.9%3.9%11.1%-1.8%4.7%132065%75%
061Industrial chemicals40.7%45.3%-3.1%-6.8%5.8%7.9%-0.2%4.7%122060%75%
062Paints & allied products9.8%8.3%1.4%3.1%5.2%4.5%2.5%3.7%172085%100%
065Agricultural chemicals & chemical products27.2%31.8%3.8%-8.1%7.5%6.3%1.2%3.6%132065%100%
066Plastic resins & materials43.0%54.7%5.6%-11.1%10.7%8.5%3.3%4.3%152075%100%
071Rubber & rubber products8.6%8.3%0.3%-0.4%2.6%2.6%0.1%2.6%142070%100%
072Plastic products15.8%16.2%0.7%-1.3%5.0%4.3%2.4%2.9%162080%100%
082Millwork13.2%21.9%7.9%1.0%7.0%6.0%4.4%3.0%192095%100%
085Logs, bolts, timber, pulpwood & wood chips9.8%15.4%3.2%-4.3%2.1%2.6%1.5%1.9%152075%100%
086Prefabricated wood buildings & components19.8%25.5%6.2%1.4%8.9%7.2%4.8%3.4%172085%100%
092Building paper & building board mill prods.49.0%131.3%60.7%0.6%27.7%18.9%11.6%6.5%122060%100%
094Publications, printed matter & printing material3.5%4.2%1.5%2.6%2.8%2.0%1.2%111292%100%
103Metal containers14.1%13.5%0.7%-0.4%4.6%5.0%2.0%2.9%142070%100%
104Hardware8.7%8.8%1.8%1.3%4.5%3.4%2.2%2.4%172085%100%
105Plumbing fixtures & fittings3.2%3.5%1.9%3.2%3.5%3.0%2.3%2.6%2020100%100%
106Heating equipment13.0%10.8%0.4%4.4%6.2%4.9%3.5%3.7%2020100%100%
107Fabricated structural metal products29.9%28.1%2.2%-0.2%10.0%7.9%4.0%4.0%172085%100%
108Miscellaneous metal products8.7%7.5%0.7%1.1%3.8%3.4%1.6%2.1%172085%100%
112Construction machinery & equipment5.2%4.5%1.2%2.2%4.0%2.6%2.3%2.6%2020100%100%
113Metalworking machinery & equipment4.3%4.1%0.7%1.4%2.4%2.1%1.6%1.6%182090%100%
114General purpose machinery & equipment6.1%6.1%1.8%2.3%3.7%3.3%2.5%2.8%2020100%100%
116Special industry machinery & equipment8.2%9.2%2.1%2.0%4.3%3.1%2.0%1.8%192095%100%
121Household furniture8.4%9.0%0.9%2.3%4.2%3.5%2.4%2.3%192095%100%
122Commercial furniture8.0%8.8%1.9%2.5%4.9%4.0%2.6%2.5%182090%100%
123Floor coverings3.7%3.3%0.3%-0.1%1.5%2.0%1.5%2.3%172085%100%
124Household appliances4.0%2.9%1.9%2.9%3.3%2.7%1.6%1.1%122060%100%
126Other household durable goods8.0%10.1%2.6%1.3%4.1%2.8%2.0%1.7%2020100%100%
131Glass4.0%6.2%3.3%1.4%2.8%2.5%2.5%1.4%152075%100%
132Concrete ingredients & related products3.8%4.1%3.8%3.3%3.8%3.6%3.7%3.8%192095%100%
133Concrete products5.6%5.0%2.7%2.7%3.9%3.6%3.5%3.4%172085%100%
134Clay construction products ex. refractories2.6%2.9%2.0%1.3%1.8%1.6%1.2%1.1%152075%100%
135Refractories3.9%4.1%0.5%5.3%3.6%3.2%2.4%3.4%182090%100%
137Gypsum products18.1%21.6%3.7%-4.2%3.8%5.6%6.9%5.0%152075%100%
138Glass containers5.4%5.2%1.7%2.7%3.3%2.5%1.8%2.6%2020100%100%
141Motor vehicles & equipment2.8%3.8%0.7%-0.1%1.6%1.6%1.3%0.9%162080%100%
149Transportation equipment, n.e.c.5.1%5.0%0.5%0.6%2.6%2.6%1.5%1.5%162080%100%
151Toys, sporting goods, small arms, etc.7.6%6.9%0.3%4.6%3.9%2.2%1.8%1.5%162080%100%
152Tobacco products, incl. stemmed & redried4.6%8.8%6.4%6.2%6.7%6.0%5.3%4.3%182090%100%
154Photographic equipment & supplies4.8%3.2%-0.1%7.1%4.0%2.8%2.8%1.3%122060%100%
156Medical, surgical & personal aid devices1.7%1.2%1.1%1.4%1.5%1.3%1.0%1.2%2020100%100%
157Other industrial safety equipment5.3%7.2%2.9%-0.9%3.6%1.7%1.9%1.8%182090%100%

2021 Top LIFO Candidates by Commodity Table: All Groupings

BLS PPI CodeBLS PPI Category DescriptionYTD 9/201Y Sep. '201Y Dec. '191Y Dec. '183Y Avg.5Y Avg.10Y Avg.20Y Avg.# Yrs w Infl.# Yrs Index Publ.# Yrs. w/ Infl. Freq.Hist. Avg. Inf. Freq.
02Processed foods & feeds9.4%9.1%2.0%2.5%4.6%2.9%1.6%2.7%172085%100%
021Cereal & bakery products5.6%4.0%0.1%0.5%2.5%2.1%1.3%2.7%162080%100%
0211Bakery products2.0%0.3%-1.1%0.7%1.1%1.3%1.5%2.3%192095%100%
0212Flour & flour base mixes & doughs15.1%11.6%1.3%-0.1%5.0%3.7%1.0%3.3%142070%100%
0213Milled rice & byproducts3.4%-0.4%6.8%2.6%3.4%4.1%1.5%5.0%152075%100%
0214Cereal & pasta products5.6%6.4%0.4%0.5%3.0%1.8%0.9%2.5%152075%100%
0221Meats25.7%25.3%3.4%5.7%11.3%6.2%3.3%3.4%152075%100%
0222Processed poultry24.1%18.4%2.2%5.1%7.4%3.5%3.0%2.5%142070%100%
022306Prepared fresh & frozen seafood13.1%5.1%4.1%0.4%5.3%4.4%81080%100%
023Dairy products2.5%-0.8%-3.0%7.7%2.3%1.1%-0.1%1.7%112055%75%
024Processed fruits & vegetables2.0%2.2%3.8%-0.8%2.1%2.0%1.7%2.7%172085%100%
0241Canned fruits & juices2.3%2.7%4.4%-2.9%0.6%0.9%1.7%2.4%152075%100%
0242Frozen fruits, juices & ades14.3%16.0%8.0%-15.8%2.8%3.7%1.2%3.4%142070%100%
0253Refined sugar products & byproducts2.7%4.3%4.7%4.4%4.3%3.3%-0.6%2.9%142070%75%
0254Confectionery materials6.2%5.6%-4.4%7.4%3.4%1.2%0.0%2.8%152075%75%
0262Soft drinks2.3%3.4%2.4%3.8%3.0%1.9%1.9%2.1%2020100%100%
0264Other beverage materials6.1%7.9%4.7%3.3%5.2%3.5%2.7%2.7%182090%100%
028Miscellaneous processed foods3.5%0.9%1.2%-1.0%1.9%2.0%1.5%2.1%162080%100%
028201Pickles & other pickled products4.4%4.1%0.8%-0.2%2.1%2.5%1.6%1.8%162080%100%
0284Specialty canning5.5%0.6%-0.3%1.5%3.1%1.9%1.8%2.0%172085%100%
0285Frozen specialty food4.8%-0.8%0.6%-0.4%1.5%0.9%0.7%1.5%142070%100%
029Prepared animal feeds8.9%19.5%9.6%0.5%4.7%3.0%0.8%4.0%152075%100%
0293Formula feeds13.4%26.1%8.6%2.5%7.3%4.3%0.8%4.6%152075%100%
0294Miscellaneous feedstuffs9.7%18.9%10.4%1.6%7.4%3.8%1.6%4.1%142070%100%
03Textile products & apparel9.6%9.0%-0.2%-0.4%3.1%2.8%1.3%1.5%132065%100%
032Processed yarns & threads17.8%16.5%-2.0%-4.3%3.4%3.9%0.1%2.1%132065%100%
0326Yarns18.3%17.1%-2.1%-4.4%3.5%4.0%0.1%2.0%142070%100%
033Greige fabrics8.9%4.7%-1.1%-2.0%2.1%1.8%-0.1%1.4%112055%75%
0337Greige broadwoven fabrics6.9%6.0%-0.8%0.4%2.4%1.9%-0.1%1.5%122060%75%
034Finished fabrics9.4%9.9%1.8%1.4%4.8%3.2%1.7%1.9%142070%100%
0342Finished broadwoven fabrics19.8%23.2%11.2%-0.8%10.1%6.2%2.5%2.9%132065%100%
0344Woven & braided narrow fabrics9.4%9.8%0.6%0.8%3.7%3.9%3.7%2.7%192095%100%
0345Nonwoven fabrics & felts10.2%10.0%-2.3%1.3%4.0%2.5%1.4%1.6%112055%100%
0347Screen printed textile materials, embroideries & lace goods4.3%4.8%1.8%3.5%3.6%2.5%1.4%1.1%172085%100%
0348Knit fabrics, finished in knitting mills5.5%5.4%1.5%2.2%3.1%2.5%1.9%141878%100%
038Apparel & other fabricated textile prods3.7%2.5%-0.1%1.3%1.7%1.5%1.5%1.2%162080%100%
0381Apparel2.7%0.2%-1.8%0.8%0.6%0.9%0.9%0.7%142070%100%
03830321Rope, cordage & twine16.4%18.9%5.6%-2.8%6.3%3.7%6967%100%
043Footwear2.8%2.8%-0.2%3.3%1.9%1.5%2.5%2.0%182090%100%
044Other leather & related products2.0%1.6%1.1%1.1%1.4%1.5%2.1%1.6%192095%100%
057Petroleum products, refined52.6%72.2%-15.3%4.9%3.9%11.1%-1.8%4.7%132065%75%
0576Finished lubricants10.4%9.3%-0.6%2.5%4.0%4.7%1.3%6.3%142070%100%
06Chemicals & allied products20.6%22.6%0.7%-2.7%5.2%5.5%2.1%4.1%172085%100%
061Industrial chemicals40.7%45.3%-3.1%-6.8%5.8%7.9%-0.2%4.7%122060%75%
0613Basic inorganic chemicals9.2%7.6%-0.8%-1.2%2.4%3.7%-0.4%4.7%122060%75%
0614Basic organic chemicals46.6%53.1%-3.6%-7.8%6.4%8.6%-0.2%4.7%122060%75%
062Paints & allied products9.8%8.3%1.4%3.1%5.2%4.5%2.5%3.7%172085%100%
0621Prepared paint10.7%8.5%1.6%2.6%5.7%4.5%3.1%3.7%182090%100%
065Agricultural chemicals & chemical products27.2%31.8%3.8%-8.1%7.5%6.3%1.2%3.6%132065%100%
0652Fertilizer materials57.6%71.0%9.8%-19.8%14.5%11.2%0.6%5.1%132065%100%
066Plastic resins & materials43.0%54.7%5.6%-11.1%10.7%8.5%3.3%4.3%152075%100%
0662Thermoplastic resins & plastics materials47.4%62.3%6.8%-12.2%11.6%9.1%3.6%4.6%152075%100%
0663Thermosetting resins & plastics materials15.6%11.8%-0.7%-4.1%4.4%4.0%1.7%2.8%162080%100%
0671Soaps & detergents4.2%3.6%0.5%1.1%1.9%1.6%1.6%1.9%162080%100%
067903Industrial gases8.1%7.4%-2.1%11.5%5.7%5.3%3.9%3.5%152075%100%
07Rubber & plastic products14.2%14.3%0.6%-1.1%4.5%3.9%1.9%2.8%172085%100%
071Rubber & rubber products8.6%8.3%0.3%-0.4%2.6%2.6%0.1%2.6%142070%100%
0711Synthetic rubber21.5%24.1%0.1%-6.1%2.6%4.5%-2.2%3.4%132065%75%
0712Tires, tubes, tread & repair materials6.9%6.4%0.3%0.5%2.9%2.1%0.3%2.8%142070%100%
0713Miscellaneous rubber products5.7%4.9%0.5%0.8%2.5%2.2%1.4%2.2%172085%100%
071304Rubber & plastics hose8.9%7.5%0.5%2.8%4.3%3.4%2.4%3.4%182090%100%
072Plastic products15.8%16.2%0.7%-1.3%5.0%4.3%2.4%2.9%162080%100%
0721Plastic construction products24.1%26.8%6.4%-0.1%9.9%7.2%4.0%4.1%172085%100%
07210603Plastics pipe45.4%58.0%14.1%-4.2%17.0%11.8%5.6%91560%100%
07210604Plastics pipe fittings & unions34.1%38.1%5.8%2.4%14.8%11.2%6.6%141593%100%
07210605Plastics plumbing fixtures9.2%9.2%2.6%0.7%4.4%3.6%2.2%141688%100%
0722Unsupported plastic film, sheet & other shapes16.7%17.9%1.1%-1.4%5.1%4.4%2.2%3.2%162080%100%
072601Parts for transportation equipment8.6%8.5%-0.3%0.0%2.9%2.1%2.0%1.3%152075%100%
072603Foam components for furniture22.2%14.2%-6.1%-8.7%1.6%3.4%2.5%3.6%122060%100%
072APlastic packaging products19.8%18.7%-1.7%-3.5%5.0%4.8%1.8%81553%100%
072BConsumer, institutional & commercial products, n.e.c.12.8%11.8%-0.2%-1.2%4.0%3.8%2.2%101567%100%
08Lumber & wood products11.9%33.5%16.1%-0.9%7.4%6.4%4.6%2.7%142070%100%
0812Hardwood lumber31.4%46.6%10.7%-11.9%8.6%6.2%4.7%2.5%122060%100%
082Millwork13.2%21.9%7.9%1.0%7.0%6.0%4.4%3.0%192095%100%
0821General millwork8.9%9.3%2.8%1.7%4.5%3.6%3.0%2.4%192095%100%
08210132Wood window & door frames, incl. door frames in door units, excl. window frames in window units40.6%45.8%10.1%-8.6%12.0%9.6%5.8%3.6%131968%100%
0822Prefabricated structural members28.6%77.7%30.7%-2.0%16.6%15.8%10.4%5.5%142070%100%
0835Hardwood veneer & plywood16.8%15.7%0.6%-1.4%4.7%5.0%3.5%121580%100%
0841Wood pallets & pallet containers, wood & metal combination36.0%40.3%2.6%4.0%12.7%10.4%6.5%4.0%152075%100%
085Logs, bolts, timber, pulpwood & wood chips9.8%15.4%3.2%-4.3%2.1%2.6%1.5%1.9%152075%100%
086Prefabricated wood buildings & components19.8%25.5%6.2%1.4%8.9%7.2%4.8%3.4%172085%100%
0913Paper13.0%11.7%-1.9%-1.5%3.3%3.4%1.4%1.9%112055%100%
0915Converted paper & paperboard products6.8%6.4%0.5%0.8%2.7%2.5%1.7%2.3%162080%100%
091503Paper boxes & containers8.8%8.5%0.0%0.3%3.0%3.3%2.6%2.6%152075%100%
091504Other corrugated & solid fiber products, including containers, pallets, pads, etc.10.7%12.5%1.2%0.3%3.8%5.3%3.4%3.9%182090%100%
0916Pressure-sensitive products7.1%5.0%0.7%0.4%3.2%2.8%1.0%1.8%111958%100%
092Building paper & building board mill prods.49.0%131.3%60.7%0.6%27.7%18.9%11.6%6.5%122060%100%
094Publications, printed matter & printing material3.5%4.2%1.5%2.6%2.8%2.0%1.2%111292%100%
10Metals & metal products34.1%40.9%6.7%-4.2%11.2%9.5%3.1%4.6%142070%100%
1012Iron & steel scrap31.0%101.4%44.0%-27.8%11.1%15.4%0.7%9.2%142070%100%
1015Foundry & forge shop products10.0%10.7%3.0%-0.8%4.0%2.8%1.6%2.8%152075%100%
101502Pressure & soil pipe & fittings, cast iron9.8%16.9%7.3%-1.7%4.9%2.8%2.3%4.7%152075%100%
101504Other gray & ductile iron castings12.9%11.3%1.6%0.5%5.1%3.7%2.0%3.1%172085%100%
1017Steel mill products107.4%109.7%2.1%-15.5%21.1%17.8%6.1%7.0%142070%100%
101705Steel wire30.4%26.3%-0.6%-5.0%7.9%8.7%2.5%6.5%112055%100%
10170810Cold finished steel bars & bar shapes17.7%23.9%8.9%-5.0%7.0%3475%100%
1023Nonferrous scrap21.8%49.2%23.1%3.4%16.7%12.1%2.3%6.8%152075%100%
1025Nonferrous mill shapes24.4%33.7%3.3%-2.0%7.4%8.2%1.6%3.2%122060%100%
10250162Extruded aluminum rod, bar & other extruded shapes29.2%40.0%2.0%-1.2%7.8%8.9%2.8%91753%100%
102502Copper & brass mill shapes30.3%48.3%19.4%-0.2%15.8%12.6%2.3%6.9%112055%100%
10250238Copper & copper alloy rod, bar & shapes23.9%41.2%21.5%0.9%15.2%12.3%2.5%111861%100%
102603Nonferrous wire & cable22.8%32.4%8.0%-1.8%8.8%7.7%1.1%4.3%112055%100%
10260314Copper wire & cable22.2%34.9%11.6%-2.1%8.8%10.6%0.3%5.8%112055%100%
102807Castings, nonferrous (except aluminum)10.5%8.9%2.1%0.3%4.0%3.5%81080%100%
103Metal containers14.1%13.5%0.7%-0.4%4.6%5.0%2.0%2.9%142070%100%
104Hardware8.7%8.8%1.8%1.3%4.5%3.4%2.2%2.4%172085%100%
1042Hand & edge tools2.7%4.6%2.5%2.5%3.2%2.4%1.8%2.1%182090%100%
105Plumbing fixtures & fittings3.2%3.5%1.9%3.2%3.5%3.0%2.3%2.6%2020100%100%
106Heating equipment13.0%10.8%0.4%4.4%6.2%4.9%3.5%3.7%2020100%100%
1061Steam & hot water equipment10.0%5.8%1.2%2.2%4.4%4.8%2.9%3.8%192095%100%
1062Furnaces & heaters, including parts6.3%8.5%1.6%7.6%5.3%4.1%2.9%2.5%172085%100%
1066Domestic water heaters32.1%22.0%-2.4%2.4%9.8%7.8%5.3%6.6%172085%100%
107Fabricated structural metal products29.9%28.1%2.2%-0.2%10.0%7.9%4.0%4.0%172085%100%
1071Metal doors, sash & trim18.8%14.7%2.9%1.7%7.7%7.1%4.1%3.5%182090%100%
1072Metal tanks28.9%33.6%4.5%3.5%12.1%7.1%3.8%3.9%142070%100%
1073Sheet metal products25.7%23.2%-0.3%-0.5%8.3%6.5%2.9%3.2%142070%100%
1074Structural, architectural & pre-engineered metal products36.7%32.1%0.9%-0.8%11.0%8.9%4.3%4.3%152075%100%
107405Fabricated structural metal38.0%30.6%-0.9%0.3%11.0%9.5%4.9%4.1%152075%100%
107408Ornamental & architectural metal work27.8%29.7%5.0%-1.0%11.6%9.3%5.1%5.4%162080%100%
107411Fabricated metal pipe, tube & fittings18.9%23.6%5.3%-1.9%7.6%5.6%61060%100%
1076Fabricated steel plate22.2%27.8%7.1%-0.5%9.2%6.1%3.2%3.4%142070%100%
1079Prefabricated metal buildings37.6%46.3%12.2%-5.4%12.9%10.7%5.9%6.6%152075%100%
108Miscellaneous metal products8.7%7.5%0.7%1.1%3.8%3.4%1.6%2.1%172085%100%
1081Bolts, nuts, screws, rivets & washers7.1%5.9%4.4%4.9%6.4%4.2%2.5%3.1%172085%100%
1083Lighting fixtures5.2%5.0%1.7%2.8%4.3%3.4%2.2%1.9%192095%100%
1088Fabricated ferrous wire products19.5%16.7%1.2%-2.3%6.1%6.8%3.4%4.4%152075%100%
108801Ferrous wire rope, cable, forms & strand18.8%14.5%1.5%-3.3%6.1%8.8%4.0%4.2%152075%100%
108807Ferrous wire cloth, other woven wire products10.6%9.9%1.7%-1.1%3.7%2.9%0.9%2.0%132065%100%
108809Other fabricated ferrous wire products21.1%18.3%1.1%-2.0%6.5%6.3%3.2%4.1%132065%100%
1114Agricultural machinery & equipment7.0%6.4%1.0%2.4%4.1%3.0%2.2%1919100%100%
112Construction machinery & equipment5.2%4.5%1.2%2.2%4.0%2.6%2.3%2.6%2020100%100%
112KParts for construction machinery & equipment, sold separately4.8%5.1%0.7%1.1%2.7%2.5%88100%100%
113Metalworking machinery & equipment4.3%4.1%0.7%1.4%2.4%2.1%1.6%1.6%182090%100%
1132Power-driven handtools, including parts & attachments5.5%4.9%2.4%1.7%3.2%2.4%2.2%1.5%172085%100%
1133Welding machines & equipment8.4%8.6%1.2%1.6%3.8%4.0%2.8%3.6%192095%100%
1136Abrasive products4.8%5.2%2.4%2.8%3.3%2.7%2.3%2.4%192095%100%
114General purpose machinery & equipment6.1%6.1%1.8%2.3%3.7%3.3%2.5%2.8%2020100%100%
1141Pumps, compressors & equipment5.2%5.4%0.7%1.0%2.8%2.8%2.4%3.0%2020100%100%
1143Fluid power equipment6.0%4.2%1.1%2.3%3.5%2.9%2.3%2.9%2020100%100%
1144Industrial material handling equipment7.3%6.8%1.7%1.3%3.9%3.4%2.7%3.0%192095%100%
114404Hoists, overhead cranes & monorail systems8.6%7.8%0.7%3.5%4.2%3.8%2.9%3.2%192095%100%
1145Mechanical power transmission equipment6.0%5.3%1.7%1.7%3.7%3.1%2.3%3.0%182090%100%
1147Air purification equipment & industrial & commercial fans & blowers6.4%7.1%1.8%3.4%4.0%3.5%2.5%2.7%192095%100%
1148Air conditioning & refrigeration equip7.8%9.1%2.6%3.1%4.6%4.2%2.7%2.5%192095%100%
114903Metal pipe fittings, flanges & unions11.8%18.3%13.6%0.9%8.0%6.9%3.2%3.1%152075%100%
116Special industry machinery & equipment8.2%9.2%2.1%2.0%4.3%3.1%2.0%1.8%192095%100%
1166Other special industry machinery13.1%15.6%4.0%2.9%6.5%4.3%2.1%1.4%152075%100%
1171Wiring devices16.7%20.8%6.0%1.9%8.3%5.4%3.1%3.3%172085%100%
1173Motors, generators, motor generator sets3.0%3.8%0.1%1.4%2.1%1.9%1.2%2.3%172085%100%
1174Transformers & power regulators18.5%20.7%0.8%2.6%7.7%6.3%2.0%3.8%142070%100%
1175Switchgear, switchboard, industrial controls equipment4.6%4.3%1.8%2.4%3.1%2.3%1.6%2.3%182090%100%
1192Mining machinery & equipment8.2%8.7%2.3%4.4%7.1%5.0%3.6%4.2%2020100%100%
121Household furniture8.4%9.0%0.9%2.3%4.2%3.5%2.4%2.3%192095%100%
1211Metal household furniture10.5%10.7%-7.5%18.2%5.4%4.5%3.0%2.2%142070%100%
1212Wood household furniture8.4%8.2%1.5%1.8%3.6%2.8%2.3%2.3%2020100%100%
1213Upholstered household furniture9.5%10.0%1.1%1.0%4.1%3.2%2.1%2.1%192095%100%
1215Metal porch, lawn, outdoor & casual furniture6.6%6.3%2.6%3.4%5.4%3.7%3.7%3.6%162080%100%
122Commercial furniture8.0%8.8%1.9%2.5%4.9%4.0%2.6%2.5%182090%100%
1221Wood office furniture & store fixtures5.6%7.5%0.6%2.7%3.3%2.8%2.1%1.8%2020100%100%
1222Nonwood furniture & store fixtures9.9%10.3%3.0%1.6%5.9%5.0%3.0%2.8%172085%100%
1224Commercial furniture & fixtures, n.e.c.8.4%8.0%2.4%5.3%5.5%3.2%2.7%2.4%182090%100%
123Floor coverings3.7%3.3%0.3%-0.1%1.5%2.0%1.5%2.3%172085%100%
124Household appliances4.0%2.9%1.9%2.9%3.3%2.7%1.6%1.1%122060%100%
126Other household durable goods8.0%10.1%2.6%1.3%4.1%2.8%2.0%1.7%2020100%100%
1261Vitreous china, fine earthenware & other pottery products5.9%6.3%3.8%1.8%3.8%3.5%2.9%2.4%2020100%100%
1266Lawn/garden equipment3.3%3.3%0.7%1.6%2.2%1.7%1.2%0.8%152075%100%
1267Cutlery, flatware (except precious), razors & razor blades2.8%2.8%2.0%0.3%1.4%0.7%1.2%1.7%182090%100%
131Glass4.0%6.2%3.3%1.4%2.8%2.5%2.5%1.4%152075%100%
132Concrete ingredients & related products3.8%4.1%3.8%3.3%3.8%3.6%3.7%3.8%192095%100%
1321Construction sand, gravel & crushed stone3.8%4.3%4.4%3.8%4.3%3.9%3.6%4.2%2020100%100%
133Concrete products5.6%5.0%2.7%2.7%3.9%3.6%3.5%3.4%172085%100%
1334Precast concrete products6.2%9.4%4.7%2.6%5.5%4.6%3.7%3.5%192095%100%
1335Prestressed concrete products9.8%10.4%-0.6%2.3%3.7%3.4%3.0%131968%100%
134Clay construction products ex. refractories2.6%2.9%2.0%1.3%1.8%1.6%1.2%1.1%152075%100%
135Refractories3.9%4.1%0.5%5.3%3.6%3.2%2.4%3.4%182090%100%
137Gypsum products18.1%21.6%3.7%-4.2%3.8%5.6%6.9%5.0%152075%100%
138Glass containers5.4%5.2%1.7%2.7%3.3%2.5%1.8%2.6%2020100%100%
1392Insulation materials15.0%11.8%1.5%-2.9%4.8%3.8%3.5%3.0%162080%100%
1394Paving mixtures & blocks7.0%5.3%-3.7%-1.0%0.5%2.0%0.6%4.5%142070%100%
1398Gaskets, packing & sealing devices4.0%3.8%1.7%0.8%2.2%2.0%1.7%2.0%192095%100%
1399Nonmetallic minerals & products, n.e.c.2.0%1.5%-0.7%1.9%0.7%0.8%1.9%2.9%182090%100%
141Motor vehicles & equipment2.8%3.8%0.7%-0.1%1.6%1.6%1.3%0.9%162080%100%
1412Motor vehicles parts3.8%3.7%0.8%-0.9%1.4%1.2%0.7%0.8%142070%100%
1414Truck trailers11.2%10.3%0.0%2.9%5.5%4.6%2.9%3.0%172085%100%
1416Travel trailers & campers10.9%12.4%3.9%2.6%5.9%5.1%3.9%3.2%192095%100%
149Transportation equipment, n.e.c.5.1%5.0%0.5%0.6%2.6%2.6%1.5%1.5%162080%100%
14911104Automobile & light truck trailers16.4%15.9%1.2%1.3%7.5%6.1%3.5%3.2%192095%100%
151Toys, sporting goods, small arms, etc.7.6%6.9%0.3%4.6%3.9%2.2%1.8%1.5%162080%100%
1511Toys, games & children's vehicles5.5%3.4%1.7%0.4%2.6%1.7%1.7%1.6%172085%100%
1512Sporting & athletic goods11.5%10.0%-0.7%8.3%5.6%2.8%2.0%1.3%142070%100%
15120185Playground equipment21.7%11.4%4.3%4.6%9.9%7.7%121486%100%
1513Small arms & ammunition2.9%3.3%1.4%0.7%1.8%1.6%1.5%2.7%182090%100%
152Tobacco products, incl. stemmed & redried4.6%8.8%6.4%6.2%6.7%6.0%5.3%4.3%182090%100%
154Photographic equipment & supplies4.8%3.2%-0.1%7.1%4.0%2.8%2.8%1.3%122060%100%
1553Manufactured homes (mobile homes), all sizes (incl. multisection)22.5%30.8%8.6%8.7%12.6%9.7%6.3%5.0%2020100%100%
156Medical, surgical & personal aid devices1.7%1.2%1.1%1.4%1.5%1.3%1.0%1.2%2020100%100%
1563Medical & surgical appliances & supplies2.5%2.0%0.4%1.7%1.5%1.3%0.9%1.2%182090%100%
1564Ophthalmic goods2.6%0.5%1.5%1.4%2.1%2.1%1.3%1.4%172085%100%
157Other industrial safety equipment5.3%7.2%2.9%-0.9%3.6%1.7%1.9%1.8%182090%100%
159705Brooms, brushes & mops16.4%2.0%0.2%2.9%6.4%4.1%2.5%2.3%192095%100%

Get a Complimentary LIFO Election Benefit Analysis Today!

  • How it works & what’s Included:
    • In-depth study performed by LIFOPro to quantify the estimated tax savings of LIFO. Includes the following:
      • 20 year pro forma LIFO calculation
        • Historical average annual inflation rate
        • Historical inflation frequency
        • Cumulative tax savings that would have occurred if LIFO was elected 20 years ago
      • Summary of findings & recommendations
        • If good LIFO candidate criteria was met based on pro forma calculation results
        • Estimated current year taxable income reduction from LIFO (if applicable)
        • Recommendation regarding if LIFO should be adopted for the current year end (if applicable)
      • How LIFO Works Appendix
      • Separate proposal with estimated costs to outsource calculation to LIFOPro or license our software delivered with report
  • Documentation Requirements
    • High-level analysis: Performed prior to LIFO Election Benefit Analysis to confirm company could be a good LIFO candidate (optional)
      • Only requires basic information, such as
        • Industry
        • Company name and/or URL
    • Mid-level analysis:
        • Basic information required for high-level analysis
        • Current & prior year end inventory balances
    • Low-level analysis:
      • Information required for mid-level analysis
      • Current & prior year end inventory item detail report(s)
      • Provides more accurate:
        • Estimated LIFO benefits
        • Estimated LIFOPro turnkey outsourcing solutions & software license cost

LIFOPro's 2020 Top LIFO Candidate GuideLIFO Candidate ID List for CPA FirmsCPA Firm Offerings

Good LIFO CandidatesHow LIFO WorksFAQs

Get a LIFO Election Benefit Analysis Report


Industry-based Index Source: Bureau of Labor Statistics Table 11 Producer Price Indexes

Commodity-based Index Source: Bureau of Labor Statistics Table 9 Producer Price Indexes

YTD 9M 9/20 inflation rates shown above use 9 months PPI inflation ended September ’20 (September ’20 ÷ December ’19 PPI)

1Y inflation rates use 12 months PPI inflation (i.e. 1Y Sep. ’20 = Sep. ’20 ÷ Sep. ’19 PPI)

3/5/10/20 Year Averages are the average annual inflation rates using compound inflation formula (not simple average inflation rates; 3Y average = ((Sep. ‘20 ÷ Dec. ‘17 PPI)^(1/3)-1))

# Periods figures & percentages is for each of the 12M periods ended December for the past 20 years between 2000 – 2019

# Periods with Inflation counts any of the 12M periods for the past 20 years between 2000 – 2019 that measured an inflation index of greater than zero