Performing comprehensive cost-benefit analysis is an essential component of the LIFO election due diligence process because it allows potential LIFO users to compare the risks and rewards of LIFO against their company’s overall risk appetite profile. It also allows potential LIFO users to forecast the long-term tax benefits & weigh them against the perceived costs. Furthermore, LIFO is an accounting method, meaning preferability must be established over the existing method & it should be assumed that LIFO will be used in perpetuity. Knowing this, it’s important to assess the long-term implications of LIFO rather than primarily focusing on the election year tax benefits.
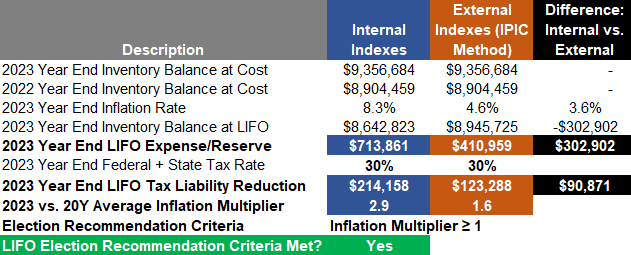
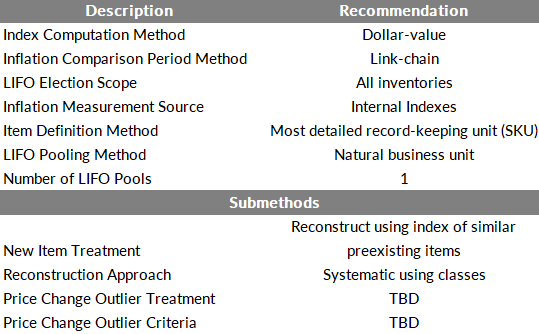
LIFOPro performs a series of pro forma LIFO calculations using a company’s current period product mix to determine whether a company is a good LIFO candidate, if a LIFO election should be made this year (or deferred to a future period), and to identify the most beneficial and practical submethods that should be used (if a current year LIFO election is recommended). The calculations made are as follows:
Using the pro forma LIFO calculation results, the following criteria are tested and scored to determine if a company is a good LIFO candidate and/or if a LIFO election is recommended:
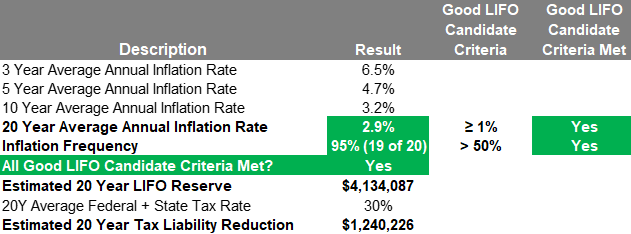
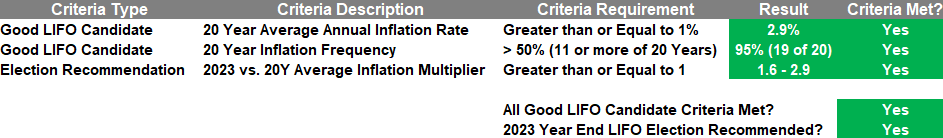
All criteria have been met for Sample Company to be considered a good LIFO candidate & for a LIFO election to be recommended for the 2023 year end.
Want to learn more about LIFO, obtaining a free LIFO election benefit analysis & LIFOPro’s turnkey outsourcing solutions prior to obtaining your complimentary LIFO Election Benefit Analysis? Schedule a free LIFO discovery call or Teams meeting with LIFOPro by calling 402-330-8573, emailing lifopro@lifopro.com or using our online scheduling tool
Schedule Free LIFO Discovery Call LIFO Discovery Call Presentation Slide Deck Sample LIFO Election Benefit Analysis Report LIFOPro's Offerings CPA Firm OfferingsRequest your complimentary benefit analysis report by completing & submitting the form below. You’ll receive your complimentary analysis PDF report & fee quote within one week of submitting this form.
Instructions:
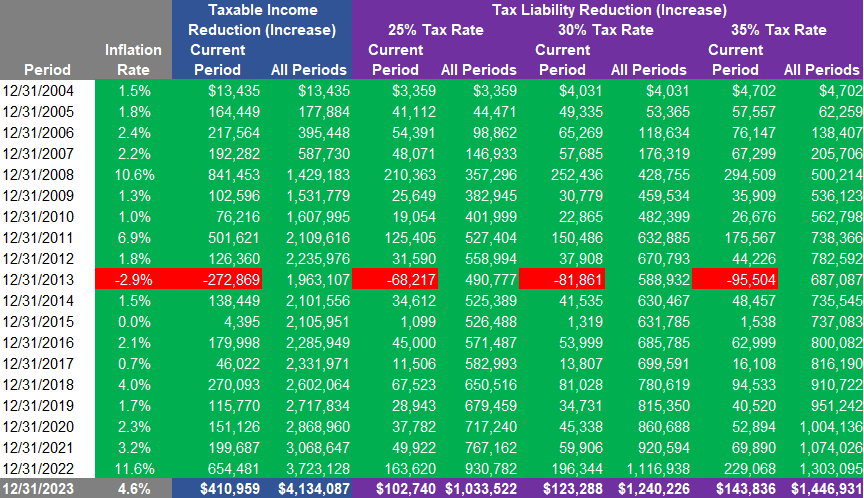
Note: LIFO is adopted on a prospective basis & LIFO tax savings accrue beginning in the year of the change. Prior period benefits can NOT be retrospectively recaptured. 20 year cumulative taxable income reduction & after-tax cash savings shown in calculator are for analysis purposes only & is provided to project the potential tax savings from LIFO that could occur over the next 20 years based on your current year inventory balance at cost & the historical inflation rates.
BLS PPI Annual Inflation Rate Averages Table for Selected Commodities Through September 2022
| PPI Code | BLS PPI Category Description | 1M 09/22 | YTD 09/22 | 1Y 09/22 | 3Y 09/22 | 5Y 09/22 | 10Y 09/22 | 20Y 09/22 |
|---|---|---|---|---|---|---|---|---|
| 01 | FARM PRODUCTS | -0.7% | 16.9% | 25.6% | 18.0% | 9.7% | 2.1% | 4.6% |
| 011 | Fruits & melons, fresh/dry vegs. & nuts | 6.0% | 13.1% | 26.6% | 11.3% | 5.6% | 5.2% | 4.6% |
| 012 | Grains | 6.3% | 17.9% | 30.4% | 27.0% | 17.5% | 0.1% | 4.8% |
| 013 | Slaughter livestock | -8.2% | 13.9% | 12.9% | 13.5% | 6.7% | 2.1% | 4.4% |
| 014 | Slaughter poultry | -5.1% | 4.6% | 19.9% | 20.9% | 8.4% | 4.8% | 5.3% |
| 015 | Raw cotton | -0.2% | 3.8% | 20.9% | 24.9% | 9.4% | 3.9% | 5.2% |
| 016 | Raw milk | -6.6% | 22.4% | 41.4% | 9.5% | 6.5% | 2.3% | 3.7% |
| 017 | Chicken eggs | 12.1% | 83.6% | 120.3% | 44.1% | 19.9% | 7.8% | 8.0% |
| 018 | Hay, hayseeds and oilseeds | -0.8% | 20.5% | 18.3% | 20.9% | 10.8% | -0.2% | 4.8% |
| 02 | PROCESSED FOODS AND FEEDS | -0.5% | 10.2% | 9.7% | 7.6% | 5.0% | 2.3% | 3.3% |
| 021 | Cereal and bakery products | 1.4% | 12.9% | 15.6% | 7.5% | 5.1% | 2.4% | 3.3% |
| 022 | Meats, poultry, and fish | -3.1% | 3.8% | -2.3% | 8.3% | 5.3% | 2.7% | 3.7% |
| 023 | Dairy products | -1.3% | 13.2% | 18.0% | 6.2% | 4.2% | 2.2% | 3.1% |
| 024 | Processed fruits and vegetables | 2.2% | 14.3% | 16.3% | 7.0% | 4.9% | 3.0% | 3.4% |
| 025 | Sugar and confectionery | 0.3% | 8.6% | 9.4% | 3.6% | 3.0% | 1.4% | 2.8% |
| 026 | Beverages and beverage materials | 0.4% | 8.6% | 10.4% | 4.9% | 3.5% | 2.1% | 2.4% |
| 027 | Fats and oils | -0.4% | 10.5% | 11.8% | 20.7% | 10.2% | 3.1% | 6.1% |
| 028 | Miscellaneous processed foods | 1.1% | 14.6% | 16.9% | 7.3% | 4.8% | 2.7% | 2.8% |
| 029 | Prepared animal feeds | 0.1% | 17.1% | 15.9% | 11.9% | 7.5% | 0.6% | 4.4% |
| 03 | TEXTILE PRODUCTS AND APPAREL | 0.3% | 8.7% | 12.9% | 7.6% | 5.2% | 2.8% | 2.3% |
| 031 | Synthetic fibers | 0.9% | 4.0% | 7.5% | 6.8% | 5.6% | 2.8% | 2.1% |
| 032 | Processed yarns and threads | -0.5% | 17.9% | 27.1% | 13.7% | 8.9% | 3.9% | 3.6% |
| 033 | Greige fabrics | 0.1% | 11.7% | 15.3% | 7.6% | 4.8% | 2.1% | 2.2% |
| 034 | Finished fabrics | 0.1% | 9.1% | 12.1% | 8.3% | 5.8% | 3.2% | 2.7% |
| 038 | Apparel & other fabricated textile prods | 0.4% | 4.2% | 7.3% | 3.7% | 2.7% | 2.1% | 1.6% |
| 039 | Miscellaneous textile products/services | 2.0% | 26.1% | 37.5% | 16.7% | 8.0% | 3.7% | 3.0% |
| 04 | HIDES, SKINS, LEATHER, AND RELATED PRODUCTS | 0.0% | 2.5% | -8.4% | 1.7% | -1.1% | -1.5% | 0.4% |
| 041 | Hides and skins, incl. cattle | 0.0% | 5.7% | -35.1% | -4.7% | -9.4% | -8.5% | -2.6% |
| 042 | Leather | 0.4% | 1.0% | -13.0% | 4.0% | -0.9% | -2.4% | 0.0% |
| 043 | Footwear | -0.2% | 6.6% | 10.0% | 4.2% | 3.3% | 2.9% | 2.5% |
| 044 | Other leather and related products | 0.0% | 4.0% | 5.0% | 2.7% | 2.3% | 2.3% | 1.8% |
| 05 | FUELS AND RELATED PRODUCTS AND POWER | 1.8% | 33.8% | 36.6% | 20.2% | 11.4% | 2.8% | 5.7% |
| 051 | Coal | 0.0% | 55.6% | 53.5% | 13.9% | 8.7% | 3.5% | 5.7% |
| 053 | Gas fuels | 5.2% | 72.8% | 93.5% | 67.2% | 24.6% | 9.3% | 6.3% |
| 055 | Utility natural gas | 2.3% | 8.7% | 33.7% | 21.9% | 11.2% | 6.2% | 4.8% |
| 056 | Crude petroleum (domestic production) | -2.8% | 33.0% | 31.1% | 16.7% | 13.3% | -1.2% | 6.1% |
| 057 | Petroleum products, refined | 2.8% | 39.5% | 40.6% | 23.4% | 13.8% | 1.0% | 7.3% |
| 058 | Asphalt and other petroleum and coal products, n.e.c. | -4.3% | 19.4% | 44.1% | 18.1% | 16.3% | 2.4% | 9.2% |
| 06 | CHEMICALS AND ALLIED PRODUCTS | -0.5% | 5.5% | 6.4% | 9.3% | 5.9% | 3.0% | 4.5% |
| 061 | Industrial chemicals | -1.5% | 5.7% | 4.1% | 14.4% | 7.6% | 1.8% | 5.2% |
| 062 | Paints and allied products | 0.1% | 17.9% | 21.4% | 11.0% | 8.6% | 3.6% | 4.4% |
| 063 | Drugs and pharmaceuticals | -0.3% | 1.7% | 2.4% | 2.1% | 2.8% | 4.4% | 4.5% |
| 064 | Fats and oils, inedible | -1.2% | 16.0% | 8.0% | 26.9% | 11.2% | 1.2% | 7.1% |
| 065 | Agricultural chemicals and chemical products | 2.8% | 14.6% | 30.8% | 20.6% | 13.2% | 4.2% | 5.6% |
| 066 | Plastic resins and materials | -0.8% | -2.1% | -3.1% | 11.1% | 6.1% | 2.7% | 4.1% |
| 067 | Other chemicals and allied products | -0.1% | 9.7% | 13.4% | 6.1% | 4.4% | 2.7% | 2.9% |
| 07 | RUBBER AND PLASTIC PRODUCTS | -0.2% | 9.2% | 14.3% | 9.8% | 6.5% | 3.4% | 3.6% |
| 071 | Rubber and rubber products | 0.1% | 11.3% | 12.7% | 7.2% | 4.8% | 1.7% | 3.2% |
| 072 | Plastic products | -0.3% | 8.6% | 14.8% | 10.6% | 6.9% | 3.9% | 3.7% |
| 08 | LUMBER AND WOOD PRODUCTS | -2.5% | 1.5% | 10.3% | 11.1% | 6.9% | 4.7% | 3.2% |
| 081 | Lumber | -6.1% | -15.3% | 6.5% | 12.0% | 5.8% | 5.2% | 2.8% |
| 082 | Millwork | -1.4% | 10.9% | 14.9% | 12.3% | 8.4% | 5.5% | 3.7% |
| 083 | Plywood | -1.2% | 8.2% | 14.7% | 17.3% | 9.0% | 4.8% | 3.7% |
| 084 | Other wood products | -0.3% | 9.9% | 7.7% | 9.8% | 7.6% | 4.7% | 3.1% |
| 085 | Logs, bolts, timber, pulpwood, woodchips and other roundwood products | -0.4% | 4.8% | 3.0% | 5.0% | 3.2% | 1.8% | 2.2% |
| 086 | Prefabricated wood buildings & components | -3.9% | 8.5% | 13.8% | 13.1% | 9.1% | 5.7% | 3.9% |
| 087 | Treated wood and contract wood preserving | -1.6% | 10.5% | 22.1% | 9.5% | 7.3% | 4.4% | 3.2% |
| 09 | PULP,PAPER, AND ALLIED PRODUCTS | 0.1% | 9.4% | 12.8% | 9.2% | 5.5% | 3.3% | 3.0% |
| 091 | Pulp, paper, and prod., ex. bldg. paper | -0.1% | 9.2% | 12.5% | 9.4% | 5.3% | 3.4% | 3.2% |
| 092 | Building paper & building board mill prods. | 2.9% | -4.6% | -6.5% | 22.1% | 9.5% | 5.9% | 5.1% |
| 094 | Publications, printed matter & printing material | 0.5% | 12.6% | 17.4% | 7.7% | 5.6% | 3.0% | |
| 10 | METALS AND METAL PRODUCTS | -2.3% | -4.6% | 0.0% | 13.0% | 8.4% | 3.8% | 4.7% |
| 101 | Iron and steel | -5.1% | -18.1% | -12.2% | 18.1% | 10.4% | 4.2% | 5.6% |
| 102 | Nonferrous metals | -1.7% | -1.8% | -1.3% | 10.0% | 6.2% | 2.6% | 5.1% |
| 103 | Metal containers | 0.3% | 19.1% | 27.0% | 12.3% | 9.6% | 4.5% | 4.0% |
| 104 | Hardware | -0.3% | 4.4% | 11.7% | 7.8% | 5.5% | 3.3% | 3.0% |
| 105 | Plumbing fixtures and fittings | 0.6% | 8.7% | 11.1% | 5.3% | 4.8% | 3.2% | 3.0% |
| 106 | Heating equipment | 1.2% | 7.1% | 14.5% | 9.7% | 7.6% | 4.6% | 4.4% |
| 107 | Fabricated structural metal products | -0.8% | 7.7% | 14.2% | 15.9% | 11.0% | 5.7% | 4.8% |
| 108 | Miscellaneous metal products | -0.2% | 6.6% | 10.9% | 6.9% | 5.5% | 2.7% | 2.7% |
| 11 | MACHINERY AND EQUIPMENT | 0.3% | 7.8% | 10.1% | 5.3% | 4.0% | 2.2% | 1.6% |
| 111 | Agricultural machinery and equipment | 0.7% | 10.1% | 16.2% | 9.0% | 6.3% | 3.7% | 3.4% |
| 112 | Construction machinery and equipment | 0.1% | 8.5% | 13.4% | 6.6% | 5.1% | 3.2% | 3.2% |
| 113 | Metalworking machinery and equipment | 0.2% | 6.7% | 9.5% | 4.8% | 3.8% | 2.4% | 2.1% |
| 114 | General purpose machinery and equipment | 0.5% | 12.2% | 15.3% | 7.9% | 6.1% | 3.8% | 3.6% |
| 115 | Electronic computers and computer equipment | -0.6% | 3.8% | 3.7% | 3.0% | -0.2% | -1.7% | -4.4% |
| 116 | Special industry machinery and equipment | -0.1% | 8.4% | 10.0% | 7.4% | 5.3% | 3.1% | 2.4% |
| 117 | Electrical machinery and equipment | 0.2% | 6.2% | 7.8% | 3.9% | 3.0% | 1.5% | 0.6% |
| 118 | Miscellaneous instruments | 0.2% | 7.6% | 9.2% | 4.2% | 3.3% | 2.4% | 2.1% |
| 119 | Miscellaneous machinery | 0.3% | 4.9% | 6.6% | 3.1% | 2.8% | 1.5% | 2.0% |
| 12 | FURNITURE AND HOUSEHOLD DURABLES | 0.5% | 7.1% | 9.3% | 6.7% | 5.1% | 2.9% | 2.4% |
| 121 | Household furniture | 0.0% | 7.1% | 10.0% | 7.5% | 5.5% | 3.3% | 2.8% |
| 122 | Commercial furniture | -0.5% | 10.0% | 12.0% | 8.2% | 6.4% | 3.8% | 3.2% |
| 123 | Floor coverings | 2.6% | -0.3 | 2.0% | 2.5% | 2.5% | 1.6% | 2.4% |
| 124 | Household appliances | -0.2% | 8.5% | 10.5% | 6.6% | 5.0% | 2.3% | 1.8% |
| 125 | Home electronic equipment | 2.5% | 6.8% | 9.0% | 5.4% | 3.6% | 1.7% | -0.6% |
| 126 | Other household durable goods | 2.1% | 5.0% | 6.6% | 5.9% | 4.1% | 2.5% | 2.0% |
| 13 | NONMETALIC MINERAL PRODUCTS | 0.3% | 12.2% | 13.8% | 7.1% | 5.5% | 4.0% | 3.9% |
| 131 | Glass | -0.5% | 6.6% | 8.9% | 5.4% | 4.3% | 3.2% | 1.8% |
| 132 | Concrete ingredients and related products | 0.5% | 11.9% | 11.9% | 6.5% | 5.3% | 4.6% | 4.3% |
| 133 | Concrete products | 0.4% | 12.5% | 15.4% | 7.5% | 6.0% | 4.7% | 4.1% |
| 134 | Clay construction products ex. refractories | 1.9% | 5.8% | 7.2% | 4.4% | 3.3% | 2.3% | 1.7% |
| 135 | Refractories | 0.6% | 10.3% | 11.1% | 6.2% | 5.6% | 3.3% | 4.0% |
| 136 | Asphalt felts and coatings | 0.6% | 16.4% | 14.9% | 10.5% | 8.0% | 3.4% | 5.6% |
| 137 | Gypsum products | 0.2% | 16.5% | 18.6% | 13.4% | 7.5% | 7.1% | 5.1% |
| 138 | Glass containers | 0.0% | 10.9% | 12.4% | 6.5% | 4.8% | 3.0% | 3.1% |
| 139 | Other nonmetallic minerals | 0.1% | 13.3% | 15.1% | 6.5% | 5.0% | 2.8% | 3.8% |
| 14 | TRANSPORTATION EQUIPMENT | 0.1% | 3.7% | 5.1% | 3.1% | 2.3% | 1.7% | 1.7% |
| 141 | Motor vehicles and equipment | 0.1% | 3.7% | 5.3% | 3.4% | 2.4% | 1.7% | 1.4% |
| 142 | Aircraft and aircraft equipment | 0.3% | 3.7% | 4.3% | 2.3% | 1.9% | 1.6% | 2.4% |
| 143 | Ships and boats | -0.4% | 4.6% | 6.1% | 3.8% | 3.1% | 2.2% | 2.8% |
| 144 | Railroad equipment | 0.4% | -1.0% | 3.1% | 1.5% | 0.8% | 1.1% | 2.3% |
| 149 | Transportation equipment, n.e.c. | 0.0% | 5.7% | 9.9% | 5.4% | 4.1% | 2.5% | 1.9% |
| 15 | MISCELLANEOUS PRODUCTS | 0.3% | 7.4% | 9.0% | 5.7% | 4.7% | 3.3% | 2.9% |
| 151 | Toys, sporting goods, small arms, etc. | -1.3% | 7.7% | 9.7% | 6.3% | 4.5% | 2.6% | 2.0% |
| 152 | Tobacco products, incl. stemmed & redried | 0.7% | 9.1% | 10.7% | 8.4% | 7.7% | 6.1% | 4.7% |
| 153 | Notions | 0.0% | 6.4% | 13.5% | 6.8% | 4.2% | 3.0% | 3.4% |
| 154 | Photographic equipment and supplies | 0.0% | 8.5% | 10.3% | 5.1% | 4.6% | 2.5% | 2.2% |
| 155 | Mobile homes | 0.9% | 8.3% | 15.0% | 15.3% | 11.7% | 7.3% | 5.6% |
| 156 | Medical, surgical & personal aid devices | 0.0% | 3.3% | 3.8% | 2.1% | 1.7% | 1.2% | 1.3% |
| 157 | Other industrial safety equipment | 0.0% | 7.4% | 9.2% | 5.8% | 4.1% | 2.6% | 2.0% |
| 159 | Other miscellaneous products | 1.3% | 12.0% | 14.9% | 7.4% | 6.0% | 3.3% | 2.8% |
| BLS CPI Code | BLS CPI Category Description | 1M | YTD | 1Y 09/22 | 3Y 09/22 | 5Y 09/22 | 10Y 09/22 | 20Y 09/22 |
|---|---|---|---|---|---|---|---|---|
| SAF | FOOD & BEVERAGES | 0.7% | 8.8% | 10.8% | 6.3% | 4.4% | 2.9% | 2.9% |
| SAF11 | Food at home | 0.6% | 10.9% | 13.0% | 7.1% | 4.5% | 2.5% | 2.7% |
| SAF114 | Nonalcoholic beverages & beverage materials | 0.8% | 11.6% | 12.9% | 6.9% | 4.6% | 2.1% | 2.0% |
| SEFN | Juices & nonalcoholic drinks | 1.2% | 11.0% | 12.7% | 7.3% | 5.2% | 2.5% | 2.1% |
| SEFN01 | Carbonated drinks | 1.3% | 11.5% | 12.4% | 7.9% | 6.3% | 2.8% | 2.7% |
| SEFN03 | Nonfrozen noncarbonated juices & drinks | 1.1% | 10.7% | 13.0% | 6.9% | 4.5% | 2.3% | 1.5% |
| SEFP | Beverage materials including coffee & tea | -0.2% | 13.0% | 13.5% | 5.8% | 3.3% | 1.2% | 1.8% |
| SEFP01 | Coffee | -0.5% | 13.8% | 15.7% | 6.6% | 3.5% | 0.9% | 2.5% |
| SEFP02 | Other beverage materials including tea | 0.4% | 11.5% | 9.5% | 4.5% | 2.9% | 1.7% | 1.4% |
| SAF115 | Other food at home | 0.2% | 12.9% | 15.7% | 7.2% | 4.5% | 2.4% | 2.4% |
| SEFT06 | Other miscellaneous foods | -0.2% | 11.2% | 15.1% | 7.3% | 4.2% | 2.4% | 2.0% |
| SEFW | Alcoholic beverages at home | -0.1% | 3.6% | 2.9% | 2.3% | 1.8% | 1.3% | 1.5% |
| SEFW01 | Beer, ale & other malt beverages at home | -0.1% | 4.8% | 4.5% | 3.7% | 2.6% | 2.1% | 2.2% |
| SEFW02 | Distilled spirits at home | -0.8% | 0.4% | 0.3% | 1.6% | 1.5% | 0.8% | 0.9% |
| SEFW03 | Wine at home | 0.1% | 4.0% | 2.7% | 1.3% | 1.3% | 0.7% | 0.8% |
| SEHE | FUEL OIL & OTHER FUELS | -2.0% | 24.0% | 39.9% | 16.2% | 9.0% | 2.6% | 6.8% |
| SAH3 | HOUSEHOLD FURNISHINGS & OPERATIONS | 0.6% | 6.7% | 9.3% | 5.5% | 4.0% | 1.5% | 0.7% |
| SAA | APPAREL | 2.2% | 7.5% | 5.5% | 0.8% | 1.5% | 0.1% | 0.2% |
| SAM1 | MEDICAL CARE COMMODITIES | -0.1% | 2.9% | 3.7% | 1.0% | 0.6% | 1.5% | 2.1% |
| SEMF | Medicinal drugs | -0.2% | 2.7% | 3.5% | 1.0% | 0.5% | 1.6% | |
| SEMF01 | Prescription drugs | -0.1% | 2.0% | 2.7% | 0.8% | 0.4% | 1.9% | 8.4% |
| SEMF02 | Nonprescription drugs | -0.4% | 4.7% | 5.6% | 1.0% | 0.8% | 0.2% | |
| SEMG | Medical equipment and supplies | 0.9% | 5.7% | 6.0% | 0.5% | 0.8% | 0.3% | |
| SAR | RECREATION | 0.1% | 3.9% | 4.1% | 3.0% | 2.1% | 1.4% | 1.1% |
| SEEA | EDUCATIONAL BOOKS & SUPPLIES | -0.4% | 4.8% | 4.6% | 1.7% | 0.8% | 2.2% | 4.1% |
| SEGA | TOBACCO & SMOKING PRODUCTS | 0.2% | 4.5% | 8.2% | 6.6% | 5.5% | 4.8% | 5.3% |
| SEGB | PERSONAL CARE PRODUCTS | 0.4% | 7.0% | 6.5% | 1.9% | 1.1% | 0.4% | 0.5% |
| SEGE | MISCELLANEOUS PERSONAL GOODS | 1.0% | 6.4% | 10.7% | 4.4% | 1.8% | 0.0% | -0.5% |
| SAG | OTHER GOODS AND SERVICES | 0.3% | 5.2% | 6.9% | 4.2% | 3.3% | 2.6% | 2.8% |
| SERE | Other recreational goods | 0.7% | 3.9% | 4.7% | 0.1% | -2.1% | -4.1% | -4.0% |
| SERG | Recreational reading materials | -1.3% | 6.3% | 5.6% | 4.5% | 3.8% | 2.6% | 1.9% |
Make the decision to elect LIFO with the utmost confidence, fully understand the risks/rewards of LIFO, and simplify the LIFO due diligence process with our complimentary LIFO Election Benefit Analysis Report. This comprehensive case study uses proprietary inflation metrics to forecast your client’s election year and long-term tax benefits of LIFO and includes recommendations regarding whether a LIFO election should be made or deferred, and recommendations on the most practical and beneficial methods to use.
Sign up today to receive industry news & promotional offers from LIFO-PRO